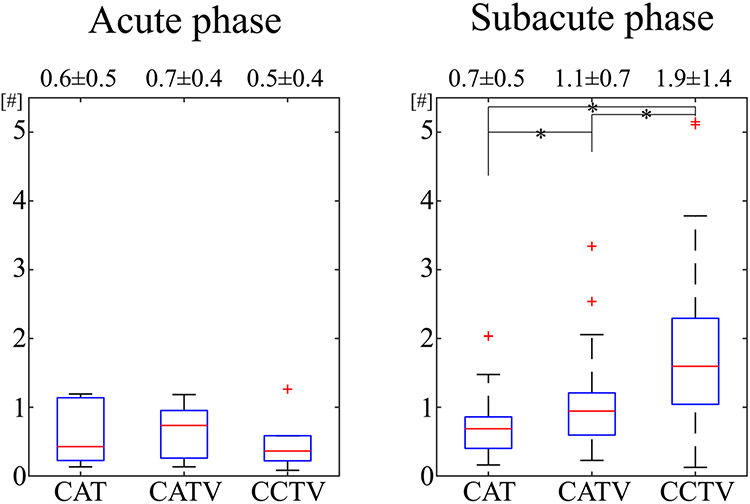
FIGURE 5.
Boxplots of OEF contrast-to-noise ratio (CNR) between the lesion and contralateral side in acute (6-24 hours post onset, ) and subacute (1-14 days post onset, ) ischemic stroke patients. The number indicates average ± SD. Asterisk (*) indicates a significant difference (). Compared with QQ-CAT and QQ-CATV, QQ-CCTV provided significantly greater CNR in the subacute phase, whereas the CNR was not significantly different in the acute phase

