Fig. 7.
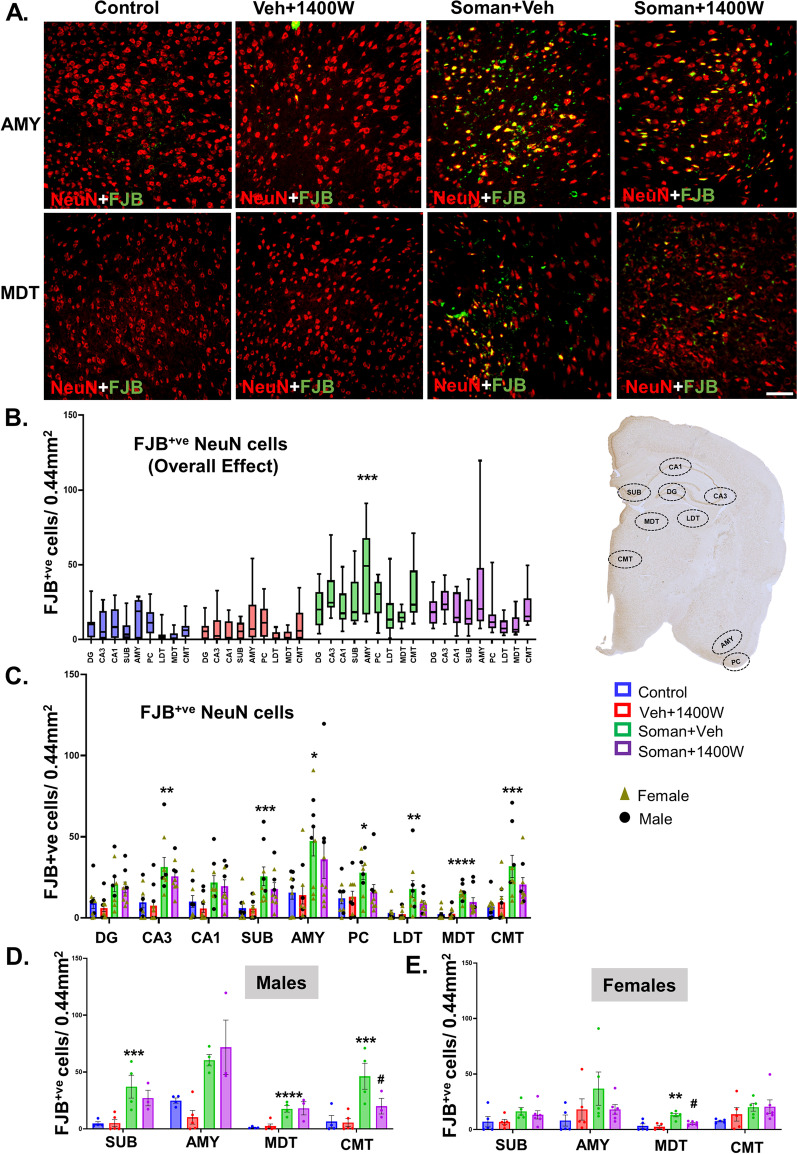
A Representative photomicrographs of the brain sections from female rats stained for NeuN (red) and FJB (green, co-label appears yellow). Amygdala (AMY) and mediodorsal thalamus (MDT); scalebar 100 µm. B–E cell quantification. Overall effect (B) and regional differences (C) in mixed sex are presented. Sex differences were observed in subiculum (SUB), amygdala (AMY), mediodorsal and centromedial thalamic nuclei (MDT, CMT). B Two-way ANOVA (Tukey’s multiple comparisons test); C–E region-wise two-way ANOVA (Tukey’s multiple comparisons test). For all, n = 9–10 for mixed-sex cohort or 3–6/sex. *p < 0.05, **p < 0.01, ***p < 0.001, ****p < 0.0001 vs control; #p < 0.05 vs soman + vehicle

