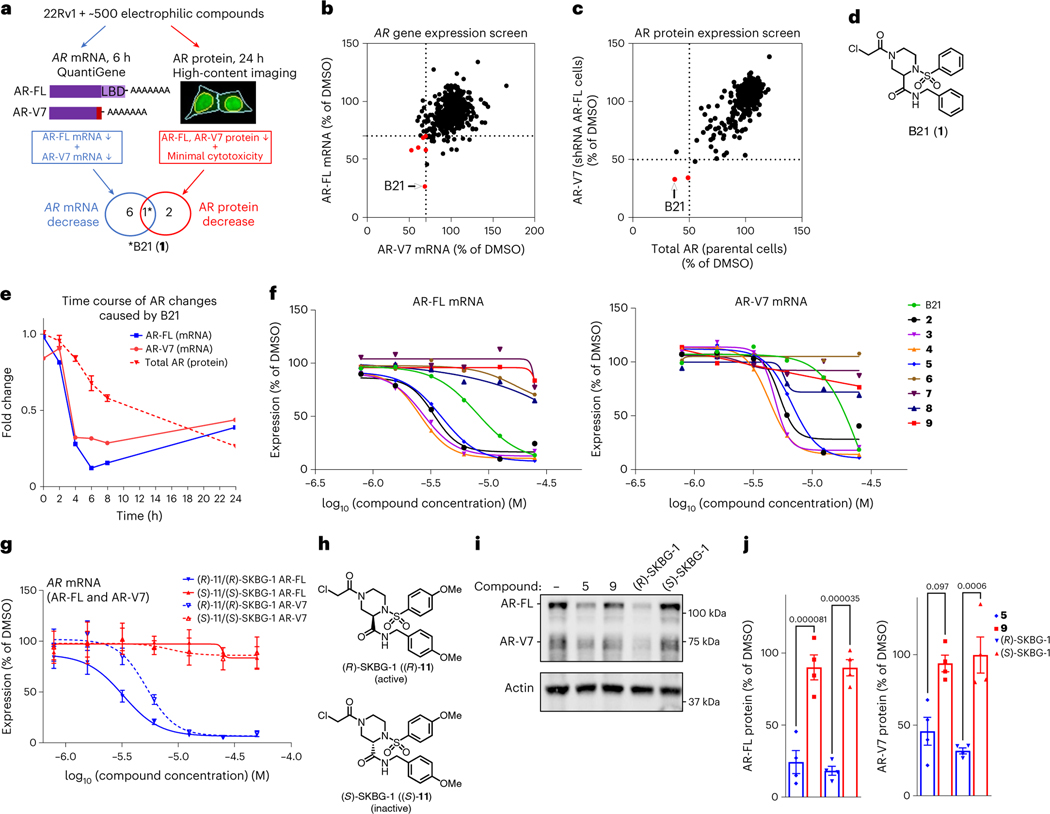
Fig. 1 |. Discovery of electrophilic compounds that deplete AR mRNA and protein in prostate cancer cells.
a, Screening workflow to discover compounds that deplete AR-FL and AR-V7 mRNA and protein content in 22Rv1 prostate cancer cells; LBD, ligand-binding domain. The light red bar in AR-V7 marks the alternative exon 3b. b,c, Screening results showing the effects of electrophilic compounds (20 μM) on the expression of AR-FL and AR-V7 mRNA (b; 20 μM compound for 6 h) and protein (c; 10 μM compound for 24 h). Hit compounds that reduced AR-FL and AR-V7 mRNA and protein by ≥30% and ≥50%, respectively, are highlighted in red. Full screens were performed once. See Supplementary Table 3 for structures of other compounds shown in red in b and c. d, Hit compound B21 (1). e, Time course of depletion of AR-FL and AR-V7 mRNA and total AR protein in 22Rv1 cells treated with B21 (25 μM). Data are shown as mean values for two replicates (mRNA) or mean values ± s.e.m. for four replicates (protein) of a single experiment representative of two independent experiments. f, Concentration-dependent effects of B21 and structural analogs (active, 2–5; inactive, 6–9; see Table 1 and Supplementary Table 4 for compound structures) on AR-FL and AR-V7 mRNA expression in 22Rv1 cells. g, Concentration-dependent effects of active (R)-SKBG-1 and inactive (S)-SKBG-1 enantiomers on AR-FL and AR-V7 mRNA expression in 22Rv1 cells. For f and g, compound treatments were for 6 h, and data are shown as mean values for two replicates (f) or mean values ± s.e.m. for four replicates (g) of a single experiment representative of two independent experiments. h, Structures of (R)-SKBG-1 and (S)-SKBG-1. i, Western blots showing AR-FL and AR-V7 protein content in 22Rv1 cells treated with active compounds (5 and (R)-SKBG-1), inactive compounds (9 and (S)-SKBG-1) or DMSO for 24 h. j, Quantification of western blotting data described in i. Data are shown as mean values ± s.e.m. for four independent experiments. P values calculated by one-way ANOVA are indicated above the bars.

