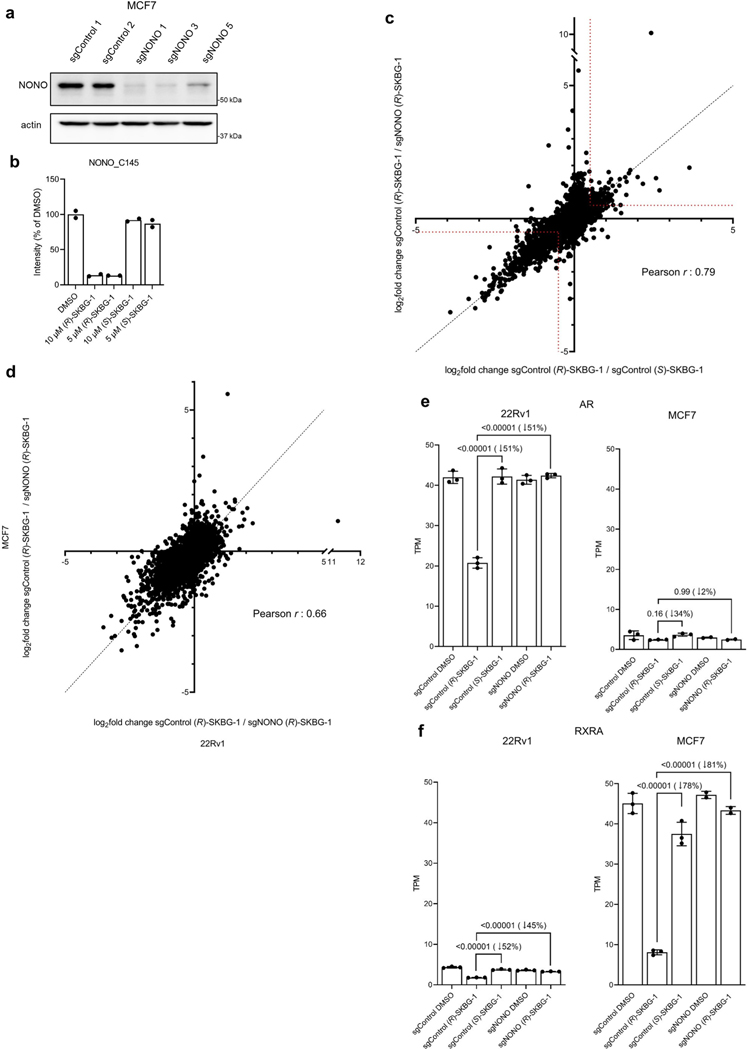
Extended Data Fig. 5 |. (R)-SKBG-1 causes similar transcriptomic changes in human prostate and breast cancer cells.
a, Western blot showing NONO content of sgControl and sgNONO MCF7 cell populations generated by CRISPRCas9. sgControl 1 and sgNONO 1 or 3 cells were used for subsequent experiments. b, Quantification of NONO_C145 engagement by (R)-SKBG-1 versus (S)-SKBG-1 in MCF7 cells determined by MS-ABPP (indicated compound concentrations, 3 h). Data are mean values for two independent cell treatments analyzed in a single MS-ABPP experiment. See Supplementary Data 1 for complete proteomic data. c, Scatter plot of mRNA log2 fold changes for sgControl MCF7 cells treated with (R)-SKBG-1 or (S)-SKBG-1 (x-axis) versus mRNA log2fold changes for sgControl or sgNONO cells each treated with (R)-SKBG-1 (y-axis). Cells were treated with compounds (5 μM) for 4 h prior to RNA-seq analysis. Genes inside the red dotted brackets were designated as decreased (log2 fold change ≤ −0.5) or increased (log2 fold change ≥ 0.5) by (R)-SKBG-1 in a NONO-dependent manner. Data are mean values for protein-coding genes with at least 50 counts in each of two-three independent replicates. d, Scatter plot of mRNA log2fold changes in (R)-SKBG-1-treated sgControl / (R)-SKBG-1-treated sgNONO 22Rv1 cells (x-axis) versus (R)-SKBG-1-treated sgControl / (R)-SKBG-1-treated sgNONO MCF7 cells (y-axis). MCF7 and 22Rv1 cells were treated with 5 and 20 μM of compounds, respectively, for 4 h, to match the respective potency of NONO_C145 engagement by (R)-SKBG-1 in each cell line (see panel b and Extended Data Fig. 2b). Data are mean values for protein-coding genes with >50 counts in each of two-three independent replicates. e, f, Quantification of AR (e) and RXRA (f) mRNA from RNA-seq experiments performed in (R)-SKBG-1 or (S)-SKBG-1-treated sgControl or sgNONO 22Rv1 and MCF7 cells. Data are mean values ± s.e.m. for two-three independent replicates. TPM, transcripts per million reads. p values from oneway ANOVA analysis are indicated above the corresponding bars, with relative percent decreases in mRNA caused by (R)-SKBG-1 in sgControl cells shown in parentheses.

