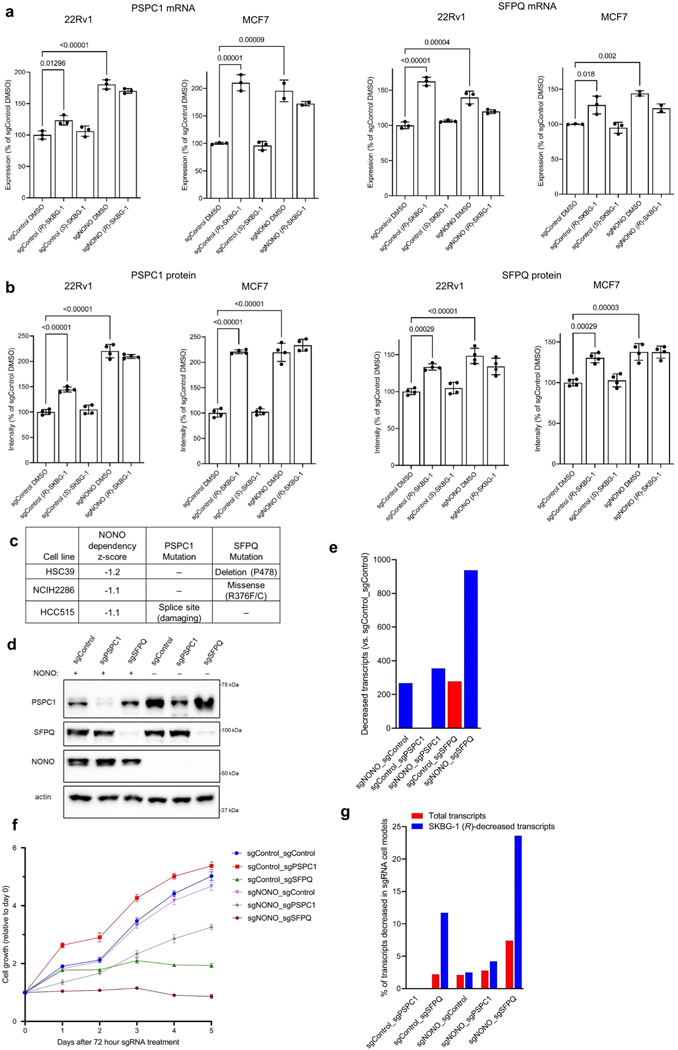
Extended Data Fig. 7 |. Crosstalk between NONO and DBHS paralogs PSPC1 and SFPQ in cells genetically or chemically disrupted for NONO.
a, Quantification of PSPC1 (left) and SFPQ (right) mRNA from RNA-seq experiments performed in (R)-SKBG-1 or (S)-SKBG-1-treated sgControl or sgNONO 22Rv1 and MCF7 cells. See Fig. 3a for more details on RNA-seq experiments. Data are mean values ± s.e.m. shown as % of the DMSO-treated sgControl groups for two-three independent replicates. p values from one-way ANOVA analysis are indicated above the bars. b, Quantification of PSPC1 (left) and SFPQ (right) protein from MS-based proteomic experiments performed in (R)-SKBG-1 or (S)-SKBG-1 -treated sgControl or sgNONO 22Rv1 and MCF7 cells. MCF7 and 22Rv1 cells were treated with 2.5 and 20 μM of compounds, respectively, for 24 h. Data are mean values ± s.e.m. for four independent replicates. p values from one-way ANOVA analysis are indicated above the bars. c, Dependency Map data showing that the three human cancer cell lines showing greatest dependency on NONO have predicted deleterious mutations in SFPQ or PSPC1. d, Western blot showing efficiency of disruption of PSPC1 and SFPQ expression in sgControl and sgNONO 22Rv1 cells following 72 h treatment with sgRNAs targeting PSPC1 or SFPQ using the Alt-R CRISPR-Cas9 nucleofection system. e, Number of transcripts that were strongly decreased (log2 fold change ≤ −0.75, padj ≤ 0.01) in the indicated sgRNA cell models relative to sgControl_sgControl cells. Red and blue bars correspond to transcripts decreased in sgControl_sgXXX (sgControl_ sgPSPC1, sgControl_sgSFPQ) and sgNONO_sgXXX (sgNONO_sgControl, sgNONO_sgPSPC1, sgNONO_sgSFPQ) cell models, respectively. f, Cell growth of indicated sgRNA cell models measured by seeding 10,000 cells overnight (72 h post-nucleofection) and following growth over a five-day additional time period as determined by CellTiterGlo, normalized to day 0 signal. Data are mean values ± s.e.m. for five independent replicates. g, Bar graph showing the percentage of overall transcripts or transcripts stereoselectively decreased by (R)-SKBG-1 (log2 fold change (R)-SKBG-1 / (S)-SKBG-1 ≤ −0.75, padj ≤ 0.01) that were also decreased in the indicated sgRNA cell models.

