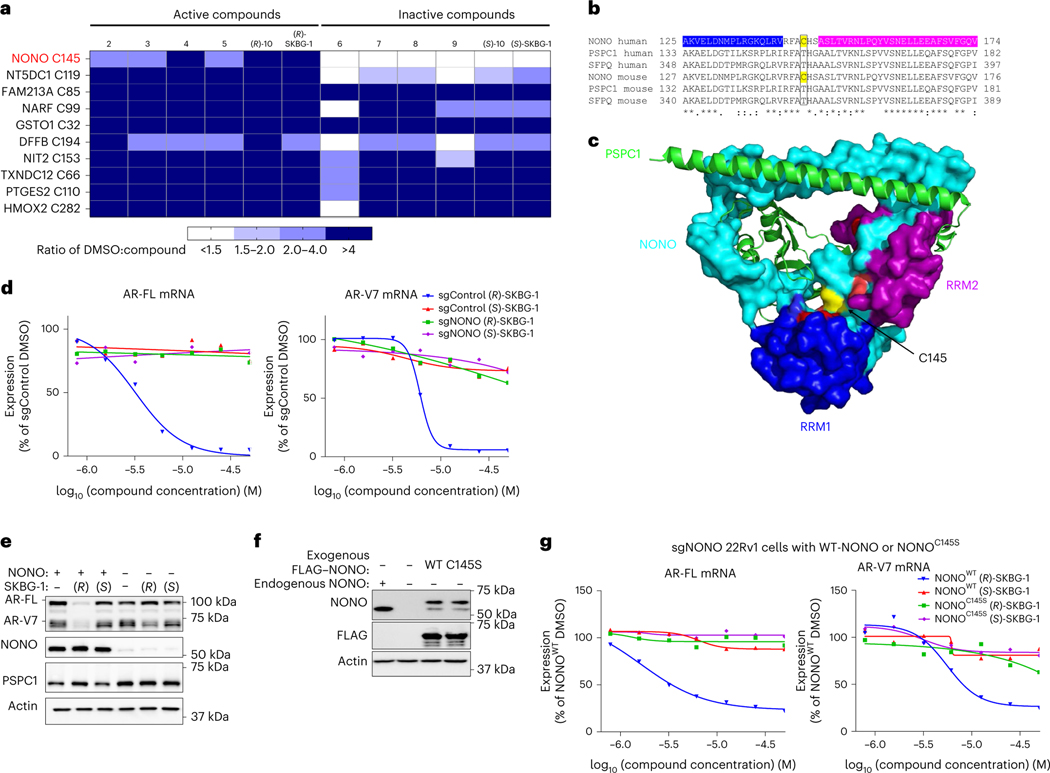
Fig. 2 |. Active compounds suppress AR expression by targeting the RBP NONO.
a, Heat map showing cysteines that were substantially (>50%) engaged by all active compounds (2–5, (R)-10 and (R)-SKBG-1; 20 μM, 1 h) in 22Rv1 cells as determined by MS-ABPP. Colors in the heat map represent the extent of cysteine engagement in DMSO-treated versus compound-treated cells. Data represent mean values from three independent experiments. See Supplementary Data 1 for full proteomic data. b, Sequence alignment of human and mouse DBHS proteins NONO, PSPC1 and SFPQ for the region around NONO C145 (yellow). The RNA-binding domains RRM1 and RRM2 of human NONO are colored in blue and magenta, respectively. c, Crystal structure of the NONO (cyan)–PSPC1 (green) dimer (Protein Data Bank ID: 3SDE) showing the location of NONO C145 (yellow) in a hinge between the RRM1 (blue) and RRM2 (magenta) domains; red, residues shown to be important for RNA binding30. d, Concentration-dependent effects of active (R)-SKBG-1 and inactive control (S)-SKBG-1 on AR-FL (left) and AR-V7 (right) mRNA content of sgControl and sgNONO cells (6 h of compound treatment). Data are shown as mean values for two replicates of a single experiment representative of two independent experiments. e, Western blots showing AR-FL and AR-V7 protein content in sgControl (NONO+) or sgNONO (NONO–) cells treated with (R)-SKBG-1 or (S)-SKBG-1 (20 μM, 24 h). Also shown are western blotting signals for NONO and PSPC1. f, Western blots showing signals for endogenous NONO in sgControl (NONO+) 22Rv1 cells and recombinantly expressed FLAG–NONO (WT or C145S) in sgNONO (NONO–) 22Rv1 cells. The FLAG–NONO-expressing sgNONO cells were generated by first stably introducing FLAG–NONO with a silent PAM site mutation and then genetically disrupting endogenous NONO by CRISPR–Cas9. g, Concentration-dependent effects of (R)-SKBG-1 and (S)-SKBG-1 on AR-FL (left) and AR-V7 (right) mRNA content of sgNONO cells expressing NONOWT or NONOC145S. AR mRNAs were quantified by QuantiGene assays at 6 h after compound treatment, and expression was normalized to DMSO-treated NONOWT cells. Data are shown as mean values of two replicates of a single experiment representative of two independent experiments.

