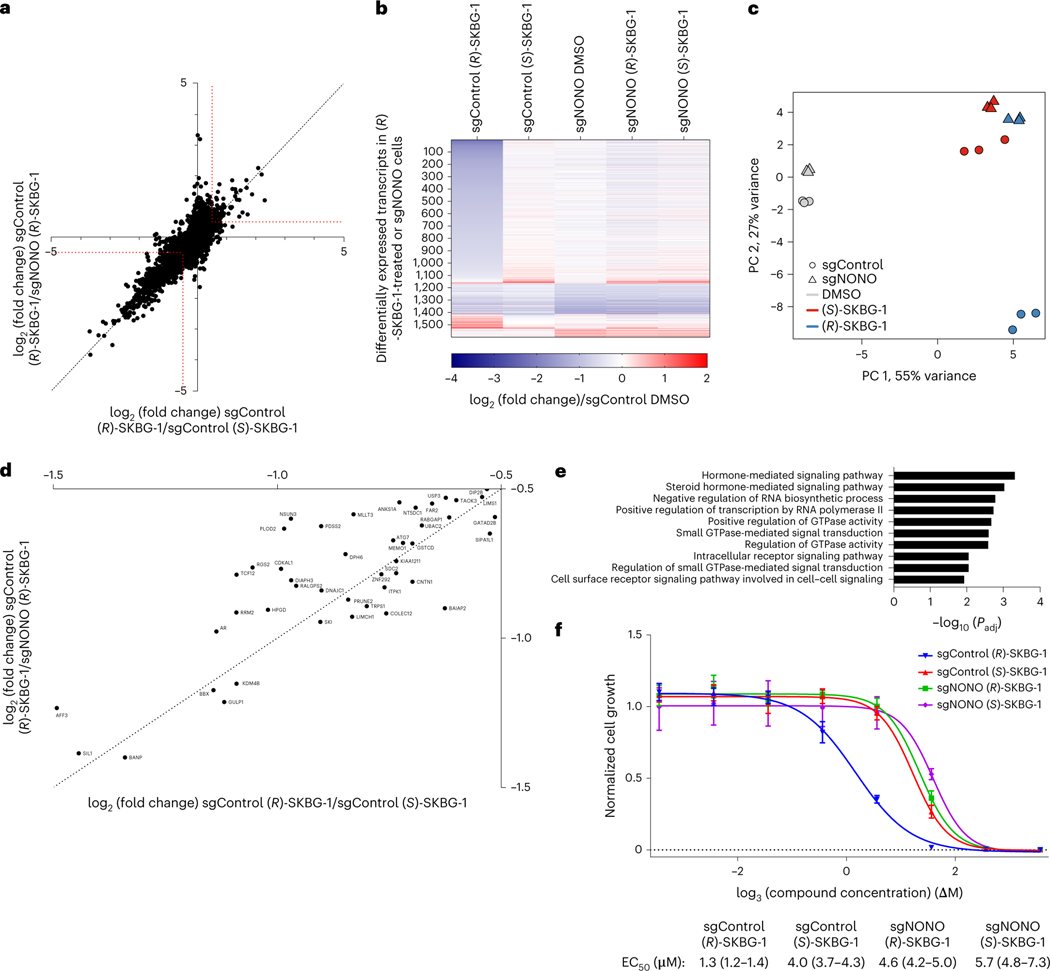
Fig. 3 |. Global effects of NONO ligands on the transcriptomes and proteomes of cancer cells.
a, Scatter plot of mRNA log2 (fold change) values for sgControl 22Rv1 cells treated with (R)-SKBG-1 or (S)-SKBG-1 (x axis) versus mRNA log2 (fold change) values for sgControl or sgNONO cells each treated with (R)-SKBG-1 (y axis). Cells were treated with compounds at a concentration of 20 μM for 4 h. Red dotted brackets designate genes decreased (log2 (fold change) ≤ –0.5) or increased (log2 (fold change) ≥ 0.5) in expression by (R)-SKBG-1 in a NONO-dependent manner. Data are shown as mean values for protein-coding genes with >50 counts in each of three independent replicates. b, Heat map showing transcripts that were substantially and significantly changed (log2 (fold change) ≤ −0.5 or log2 (fold change) ≥ 0.5, Padj ≤ 0.01) by (R)-SKBG-1/(S)-SKBG-1 in sgControl cells or DMSO-treated sgNONO/sgControl cells. c, PCA plot of RNA-seq data for the indicated groups, revealing that sgControl 22Rv1 cells treated with (R)-SKBG-1 are substantially separated from the other three compound-treated groups ((R)-SKBG-1-treated sgNONO cells and (S)-SKBG-1-treated sgControl and sgNONO cells). d, Scatter plot showing proteins that were specifically decreased in expression by (R)-SKBG-1 in a NONO-dependent manner. Cells were treated with compounds at a concentration of 20 μM for 24 h. The following are the displayed plotted proteins: (1) ≥30% decrease in (R)-SKBG-1-treated sgControl cells relative to DMSO control, (2) a log2 (fold change) for (R)-SKBG-1/(S)-SKBG-1 in sgControl cells of ≤−0.5 and (3) a log2 (fold change) for (R)-SKBG-1 in sgControl cells/(R)-SKBG-1 in sgNONO cells of ≤−0.5. Data are shown as average values from two independent experiments each containing two replicates. e, GSEA showing the ten most significantly downregulated pathways in (R)-SKBG-1-treated sgControl 22Rv1 cells compared to (R)-SKBG-1-treated sgNONO cells. f, Effects of (R)-SKBG-1 and (S)-SKBG-1 on the growth of sgControl and sgNONO cells. Cells were treated with the indicated concentrations of compounds for 6 d, and cell growth was determined by CellTiterGlo. Data are shown as mean values ± s.e.m. normalized to DMSO-treated control cells for four independent replicates. EC50 values are reported with 95% confidence intervals shown in parentheses.

