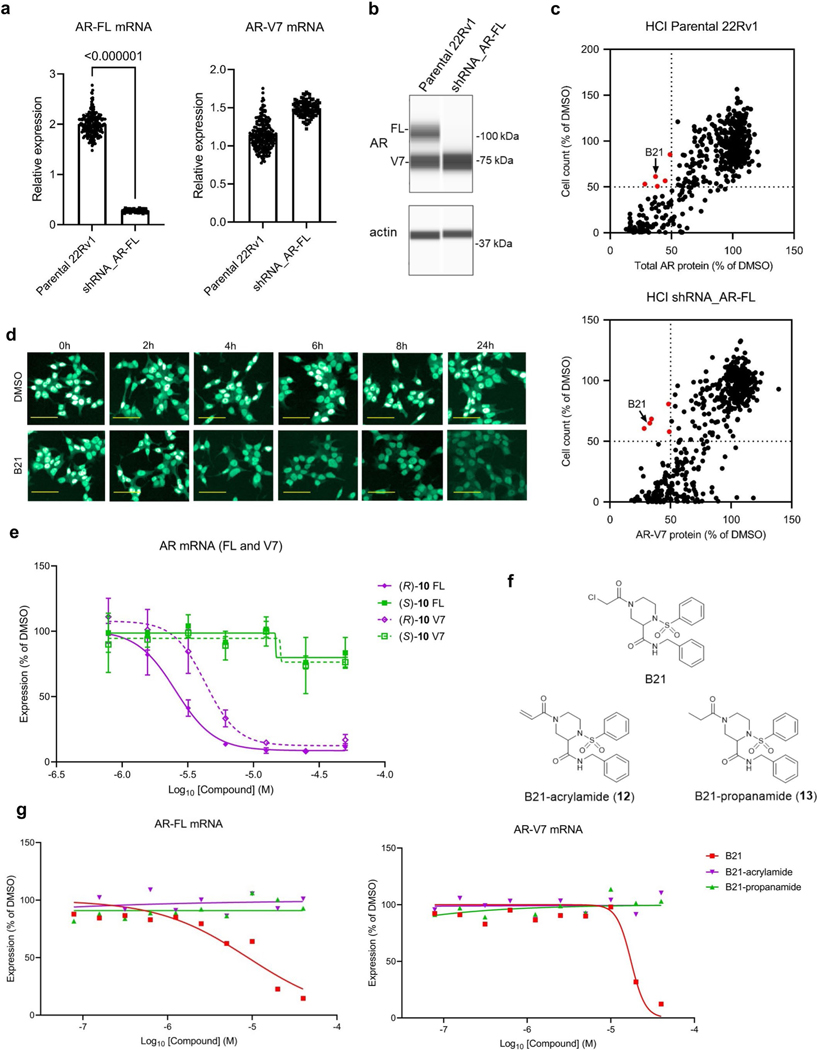
Extended Data Fig. 1 |. Discovery of electrophilic compounds that deplete AR mRNA and protein.
a, AR-FL and AR-V7 mRNA content in parental 22Rv1 cells and 22Rv1 cells stably expressing an shRNA targeting AR-FL (shRNA_ARFL cells) as quantified by QuantiGene assays and normalized relative to a set of housekeeping genes. Data are mean values ± s.e.m. for 96 data points from two independent experiments. p values from unpaired t-test (two-tailed) are indicated above the bars. b, Western blot showing AR-FL and AR-V7 protein content in parental 22Rv1 cells and shRNA_AR-FL 22Rv1 cells. Data are from a single experiment representative of at least two independent experiments. c, AR protein content and cell counts (used as a cytotoxicity estimate counter screen) measured by high content imaging (HCI) after treatment of parental (upper) or shRNA_AR-FL (lower) 22Rv1 cells with electrophilic compounds (10 μM, 24 h). Hit compounds depleting AR protein content by ≥ 50% while maintaining cell counts ≥ 50% relative to DMSO are highlighted in red. See Supplementary Table 3 for structures of other hit compounds in addition to B21. d, Representative HCI images of time-dependent effects of hit compound B21 (25 μM) on total AR protein in 22Rv1 cells. See Fig. 1e for quantification of these data. Scale bar: 50 μM. e, Concentration-dependent effects of active (R)-10 and inactive (S)-10 enantiomers (see Table 1 for compound structures) on AR-FL and AR-V7 mRNA in 22Rv1 cells. Compound treatments were for 6 h, and Data are mean values ± s.e.m. for four replicates of a single experiment representative of two independent experiments. f, Structures of B21 (1) and analogues where the α-chloroacetamide reactive group was replaced with an acrylamide (12) or non-electrophilic propanamide (13). g, Concentration-dependent effects of B21, 12, and 13 on ARFL and AR-V7 mRNA in 22Rv1 cells. Compound treatments were for 6 h, and Data are mean values for two replicates of a single experiment representative of two independent experiments.

