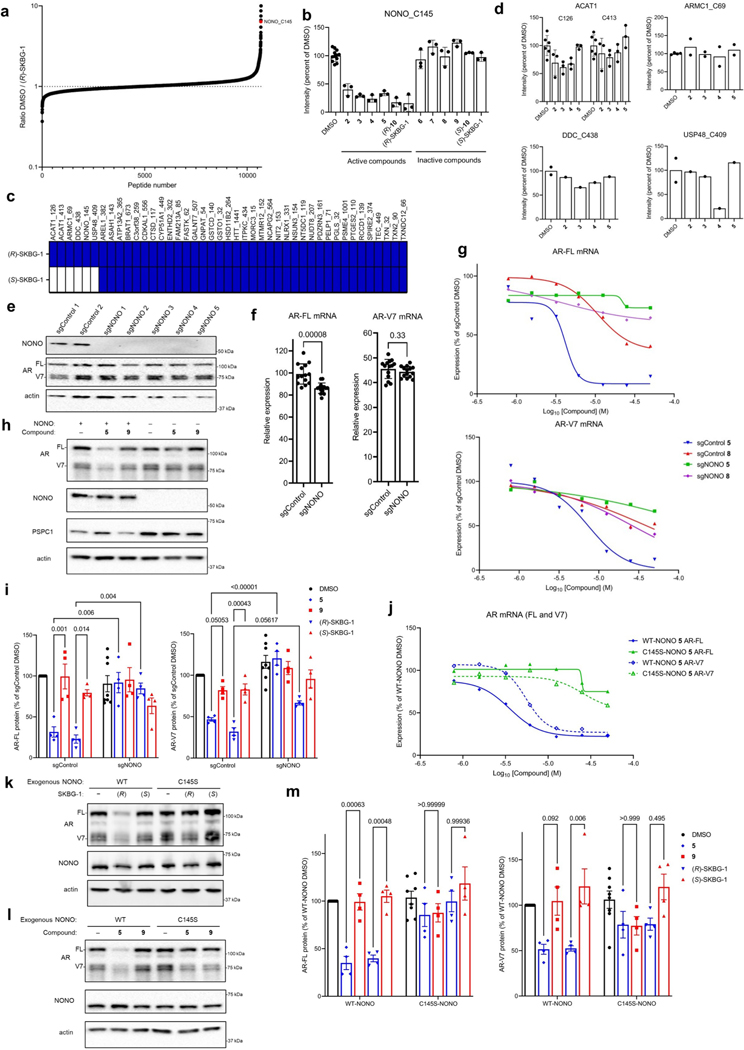
Extended Data Fig. 2 |. Active compounds suppress AR expression by targeting NONO.
a, Global cysteine reactivity profiles of 22Rv1 cells treated with DMSO or (R)-SKBG-1 (20 μM, 1 h) as determined by MS-ABPP. Data are mean values from three independent experiments, where cysteines were quantified in at least two experiments. Maximum quantifiable ratio values were set at 10 and 0.1. The ratio for NONO_C145 is marked in red. b, Quantification of NONO_C145 engagement by active (2–5, (R)-10 and (R)-SKBG-1) and inactive (6–9, (S)-10 and (S)-SKBG-1) compounds as determined by MS-ABPP. Data are mean values ± s.e.m for three independent experiments. c Heat map showing cysteines substantially (> 75%) engaged by (R)-SKBG-1 (20 μM) at 6 h in 22Rv1 cells and their corresponding engagement by (S)-SKBG-1 as determined by MS-ABPP. Blue and white respectively designate cysteines engaged ≥ 50% or < 50% by the indicated compounds. d, Engagement of the stereoselective targets of (R)-SKBG-1 from (c) by other active compounds 2–5 (20 μM, 1 h) in MS-ABPP experiments. For c, d, data represent mean values from three independent experiments. For a-d, see Supplementary Data 1 for full MS-ABPP data. e, Western blot showing NONO and AR-FL and V7 protein content of sgControl and sgNONO 22Rv1 cell populations generated by CRISPR-Cas9. sgControl 1 and sgNONO 5 cells were used for subsequent experiments. Data are from a single experiment representative of two independent experiments. f, AR-FL and AR-V7 mRNA content of sgControl and sgNONO cells. Data are mean values ± s.e.m. for 14 data points from two independent experiments. p values from unpaired t-tests. g, Concentrationdependent effects of active compound 5 and inactive control 8 (6 h treatments) on AR-FL (left) and AR-V7 (right) mRNA content of sgControl and sgNONO cells. Data are mean values for two replicates of a single experiment representative of two independent experiments. h, Western blots showing AR-FL and AR-V7 protein content in sgControl (NONO+) or sgNONO (NONO-) cells treated with active compound 5 and inactive control 9 (20 μM, 24 h). Also shown are western blotting signals for NONO and PSPC1. i, Quantification of western blotting data for AR-FL and AR-V7 in h and Fig. 2e. Data are mean values ± s.e.m. for four independent experiments. p values from two-way ANOVA. j, Concentration-dependent effects of compound 5 (6 h treatment) on AR-FL and AR-V7 mRNA content of sgNONO cells expressing WT-NONO or C145S-NONO. Data are mean values for two replicates of a single experiment representative of two independent experiments. For g and j, AR mRNAs were quantified by QuantiGene. k, l, Western blots showing AR-FL and AR-V7 protein content of sgNONO cells expressing WT-NONO or C145SNONO treated with active compounds (R)-SKBG-1 (k) or 5 (l) and inactive controls (S)-SKBG-1 (k) or 9 (l) (20 μM compounds, 24 h). m, Quantification of western blotting data for AR-FL and AR-V7 in k and l. Data are mean values ± s.e.m. for four independent experiments. p values from two-way ANOVA.

