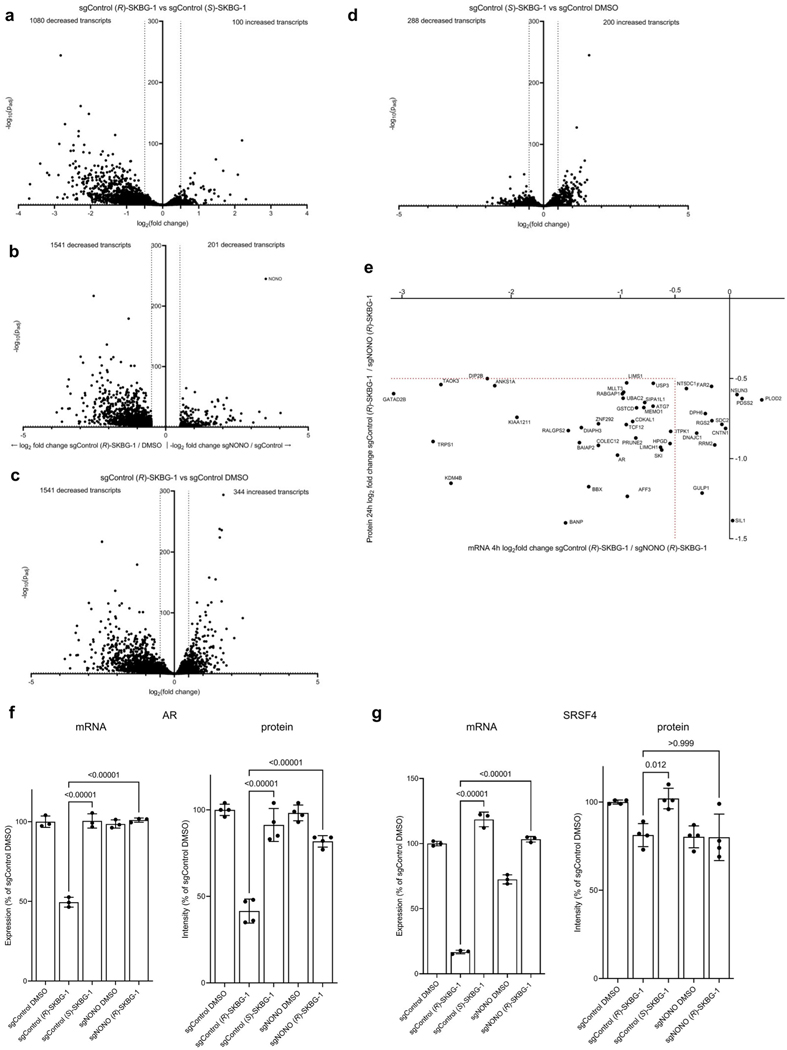
Extended Data Fig. 4 |. Global effects of NONO ligands on the transcriptomes and proteomes of cancer cells.
a, Volcano plot of mRNA log2 fold changes in (R)-SKBG-1-treated sgControl cells/(S)-SKBG-1-treated sgControl cells. Dotted lines indicate cutoffs for genes with significantly decreased (log2 fold change ≤ −0.5, padj ≤ 0.01) or increased (log2 fold change ≥ 0.5, padj ≤ 0.01) expression. log2 fold change values are mean values from three independent replicates. Plotted are protein-coding genes with >50 counts in each of three independent replicates and a coefficient of variation for gene counts < 0.5. b, Volcano plot of genes significantly decreased by (R)-SKBG-1-treated sgControl cells relative to DMSO-treated sgControl cells (left) and of genes significantly decreased by DMSO-treated sgNONO cells relative to DMSO-treated sgControl cells (right). Significantly decreased was defined as log2 fold change ≤ −0.5, padj ≤ 0.01. log2 fold change values are mean values from three replicates. Plotted are proteincoding genes with at least 50 counts in at least three samples, and a coefficient of variation for gene counts < 0.5 among the three replicates. c, Volcano plot of mRNA log2 fold change in (R)-SKBG-1-treated sgControl cells / DMSO-treated sgControl cells. d, Volcano plot of mRNA log2 fold change in (S)-SKBG-1-treated sgControl cells / DMSO-treated sgControl cells. For a–d, differential expression p values were adjusted with the Benjamini-Hochberg procedure for multiple comparisons. e, Scatter plot comparing mRNA log2 fold changes (x-axis) versus protein log2 fold changes (y-axis) in (R)-SKBG-1-treated sgControl / (R)-SKBG1-treated sgNONO 22Rv1 cells for proteins found by MS-based proteomics to be specifically decreased by (R)-SKBG-1 in a NONO-dependent manner (see Fig. 3d). Gene products inside the red dotted brackets show consistent mRNA and protein changes. f, g, Comparison of mRNA and protein content for AR (f) and SRSF4 (g) in the indicated treatment groups as measured by RNA-seq (4 h post-treatment with compounds) or MS-based proteomics (24 h post-treatment with compounds), respectively. Data are mean values ± s.e.m. for three (RNA-seq) or four (MS-based proteomics) independent replicates. p values from one-way ANOVA analysis are indicated above the bars.

