Figure 3.

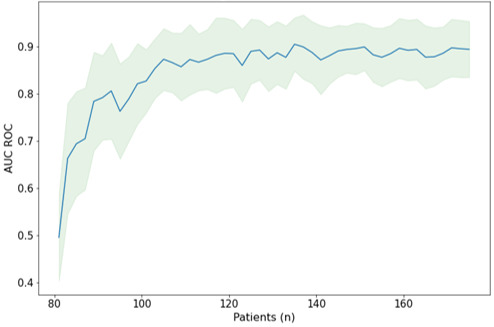
Learning curve for the random forest model, showing the graphical representation of the relationship between model performance (area under the receiver operating characteristic curve [AUC ROC]) and the number of patients used for training.

Learning curve for the random forest model, showing the graphical representation of the relationship between model performance (area under the receiver operating characteristic curve [AUC ROC]) and the number of patients used for training.