
Figure 1: Mist1 lineage tracing increases in epithelial regeneration.
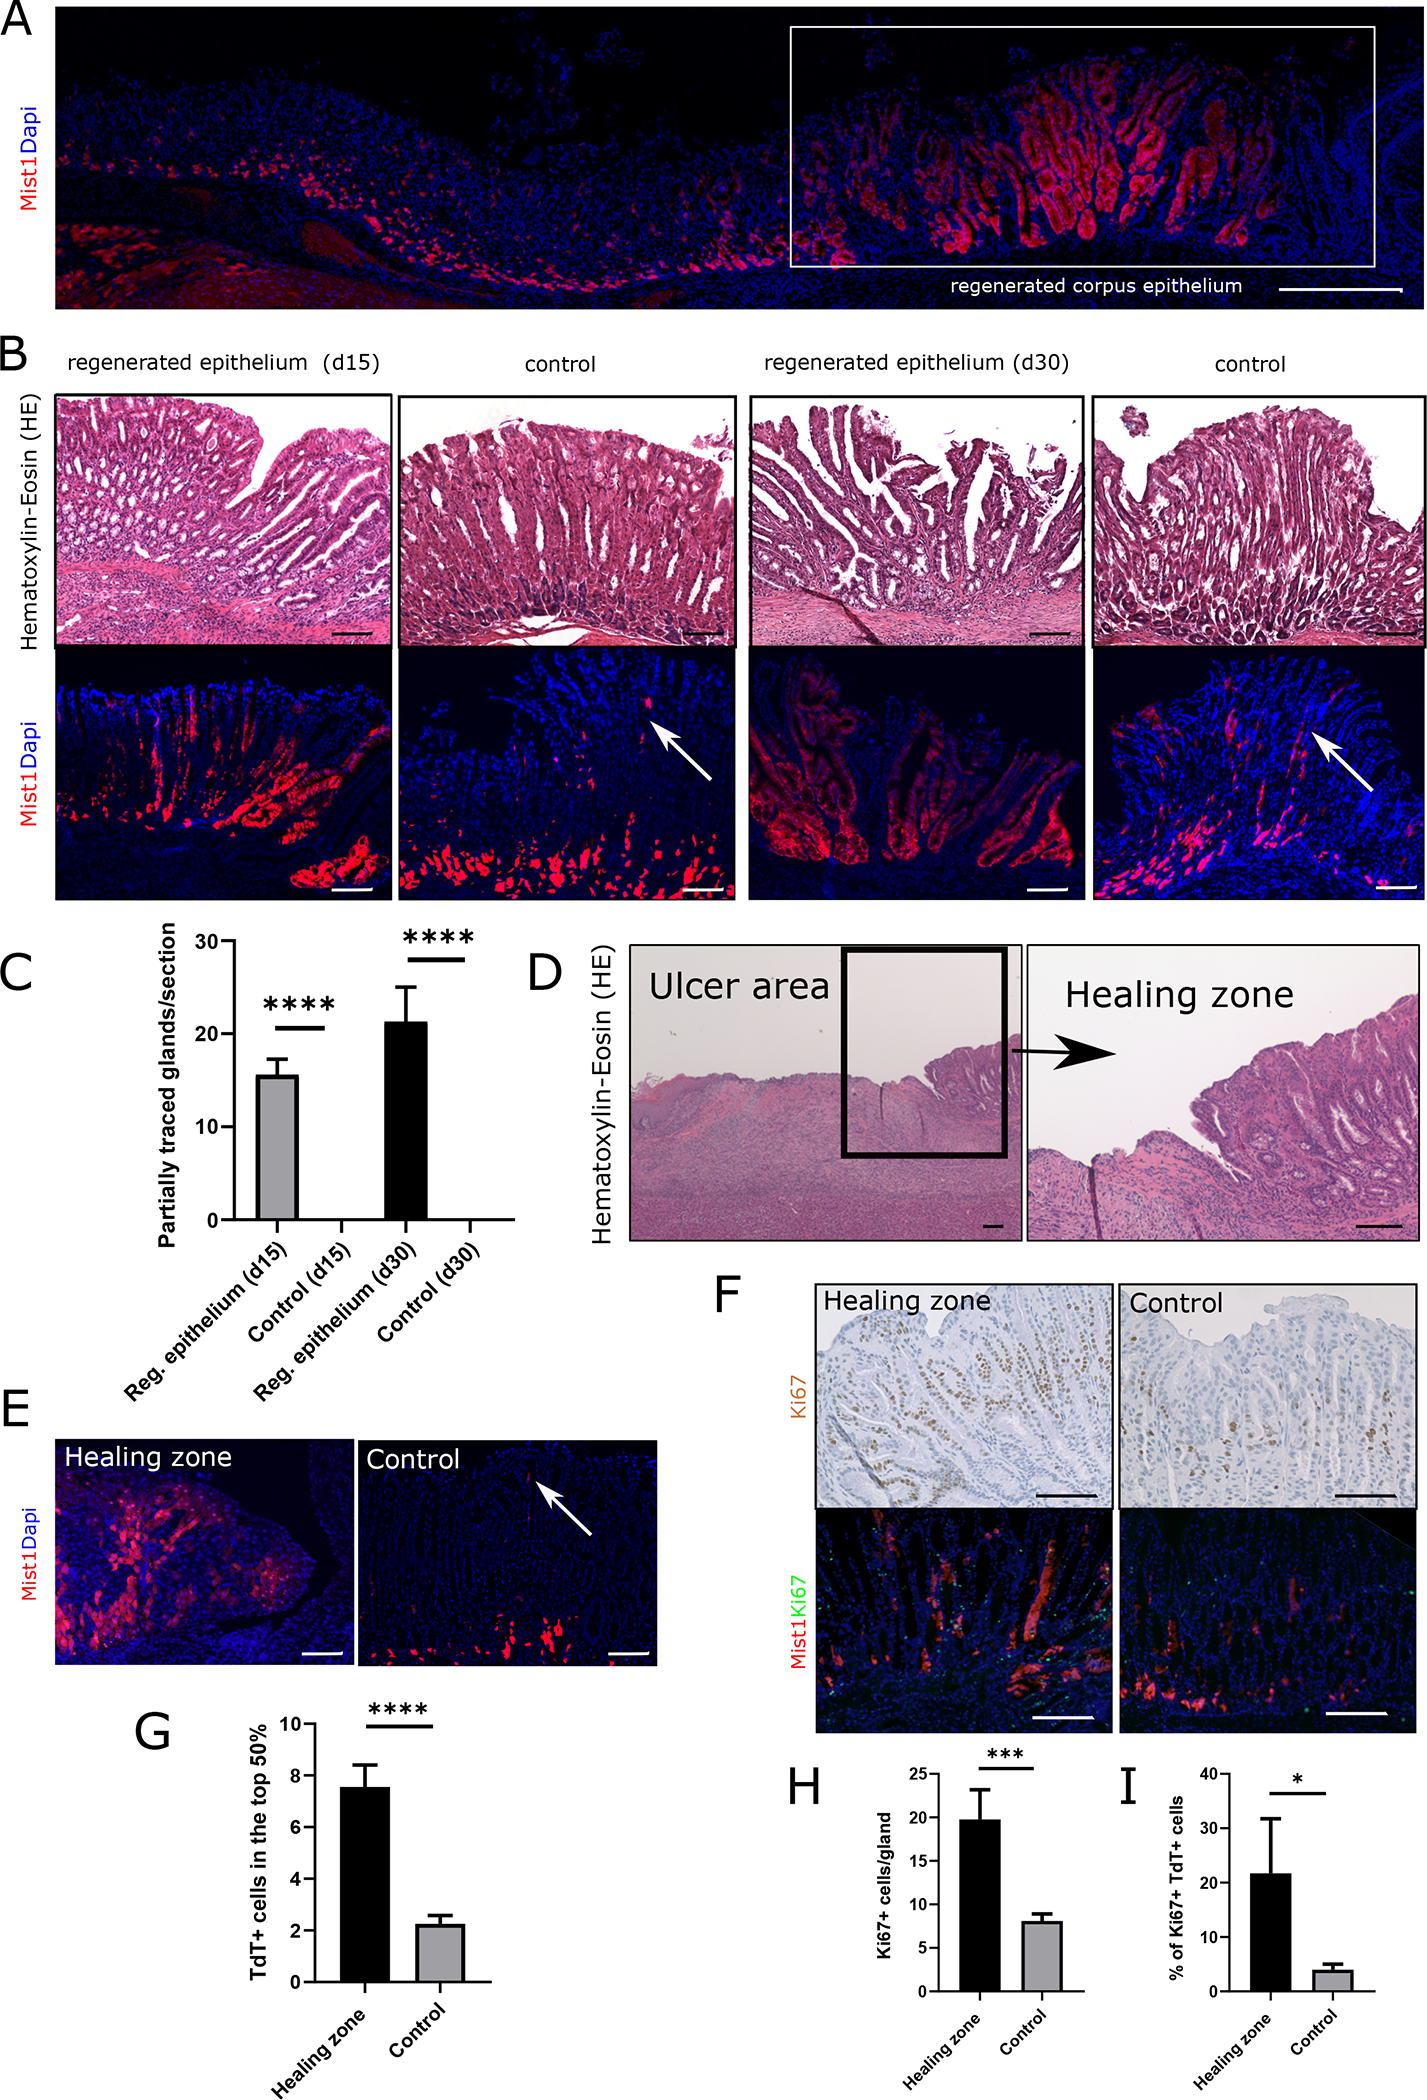
(A) Immunofluorescence of a cross section through the stomach epithelium of Mist1CreERT2;R26-Tdtomato mice at d30 after ulcer injury. Boxed area shows the regenerating epithelium in the corpus. (Scale bar = 500μm) (B) HE staining and immunofluorescence of Mist1CreERT2;R26-Tdtomato mice at d15 and d30 after ulcer injury. White arrows indicate Mist1;TdT+ isthmus stem cells in the control tissue. (Scale bars = 100μm) (C) Quantification of partially traced glands by Mist1;TdT+ cells at d15 and d30 after injury. Results are presented as means +/− SEM, *** p<0.001, * p<0.05 (n=6–7 animals per time point) (D) HE staining of the ulcer area in a WT mice at d7 after injury. Boxed area shows high magnification of healing zone at the wound edge. (Scale bars = 100μm) (E) Immunofluorescence of the healing zone in a Mist1CreERT;R26-Tdtomato mice at d7 after injury and corresponding imaging of uninjured control tissue. The white arrow in the control image indicates Mist1;TdT+ cells in the isthmus. (Scale bars = 100μm) (F) Image panel top: Ki67 staining of the healing zone in a WT mouse at d7 after injury and of corresponding uninjured control tissue. Ki67+ cells are labeled in brown. (Scale bars = 100μm) Image panel bottom: Ki67 staining and immunofluorescence of the healing zone and corresponding control tissue in Mist1CreERT;R26-Tdtomato mice at d7 after ulcer injury. Ki67+ cells are labeled in green. (Scale bars = 50μm) (G) Graph bar quantification of Mist1;TdT+ cells in the top half of the gland. (n=4) (H) Quantification of Ki67+ cells/gland and (I) percentage of Ki67+ Mist1;TdT+ cells in healing zone and control tissue (n=3)
In all figures results are presented as means +/− SEM, **** p<0.0001, *** p<0.001, ** p<0.01, * p<0.05