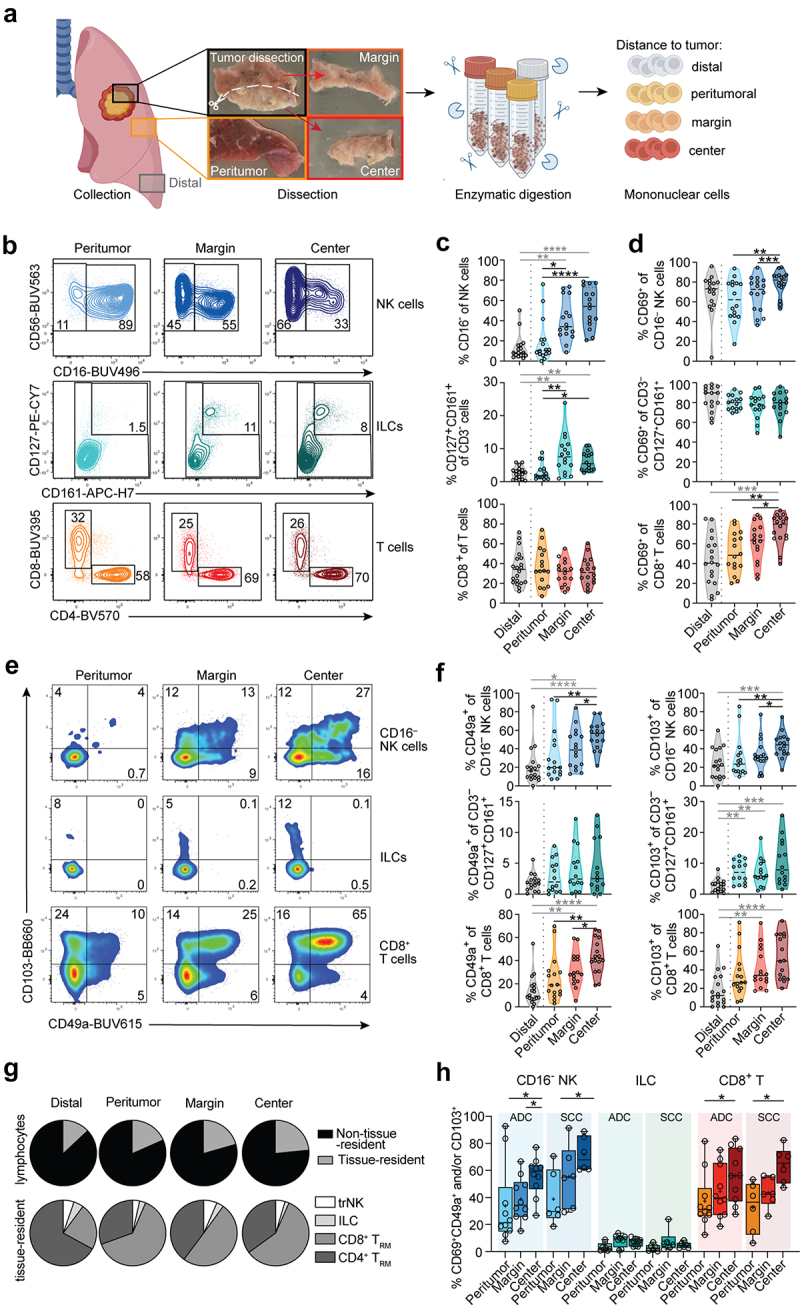
Figure 1.

Distribution of CD16− NK cells, ILCs, and CD8+ T cells in human lung tumors. (a) Graphical overview of workflow. Created with BioRender.com. (b) Representative contour plots and (c) summary of frequencies of CD16− NK cells, CD127+CD161+CD3− ILCs, and CD8+ T cells, respectively. (d) Frequencies of CD69+ cells among CD16− NK cells, ILCs, and CD8+ T cells in tumor-free and intratumoral tissues (n = 16–20) are shown. (e) Representative pseudocolor plots and (f) frequencies of CD49a and CD103 expression on CD16− NK cells, ILCs, and CD8+ T cells in tumor-free and tumor areas (n = 14–18). (g) Pie charts showing the composition of tissue-resident cells within the total lymphocyte (upper row) or tissue-resident (lower row) population (n = 15–17). (h) Frequencies of trNK cells, ILCs, and CD8+ TRM cells co-expressing CD69, CD49a, and/or CD103 (n = 14–16). (c, d, f, h) Friedman test, Dunn’s multiple comparisons test (patient-matched, black); Kruskal–Wallis test (unmatched, gray). *p < 0.05, **p < 0.01, ***p < 0.001, ****p < 0.0001.
