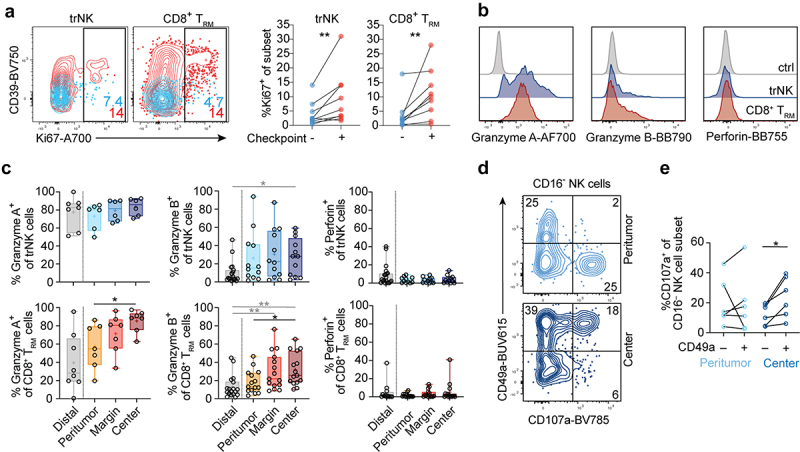
Figure 4.

Cytotoxic profiles of trNK cells and CD8+ TRM cells in lung tumors. (a) Representative contour plots (left) and summary data (right) of Ki67 expression on checkpoint receptor negative (blue) or positive (red) trNK and CD8+ TRM cells (n = 9). (b) Representative overlays (tumor center) and (c) summary of data showing frequencies of granzyme A, granzyme B, and perforin expression in trNK cells and CD8+ TRM cells in different tumor and tumor-free tissue areas (n = 7–19). (d) Representative contour plots displaying degranulation in response to K562 target cells. CD16− NK cells from peritumoral tissue or tumor center were gated. (e) Frequencies of CD107a+CD49a−CD16− and CD107a+CD49a+CD16− NK cells following stimulation with K562 target cells. Data from unstimulated controls have been subtracted (n = 6). (c) Friedman test, Dunn’s multiple comparisons test (patient-matched, black); Kruskal–Wallis test (unmatched, gray). (a, e) Wilcoxon test. *p < 0.05, **p < 0.01.
