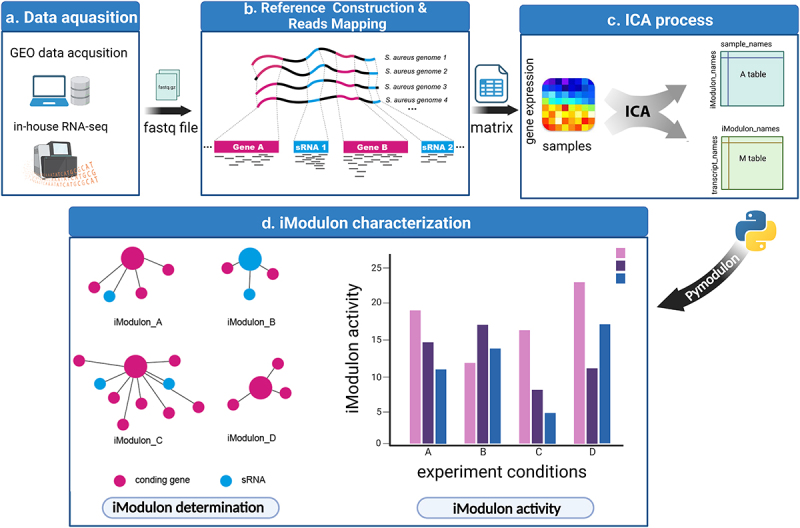
Figure 1.

Schematic illustration displaying the procedure of this study. (a) RNA-seq data were either downloaded from the GEO database or generated in-house. Samples without detailed experimental information or with no experimental replicates were excluded. (b) RNA-seq reads were mapped to the S. aureus pangenome reference and transcripts abundances were quantified using salmon software. (c) Expression matrix derived from the previous step was used as the input data for the ICA analysis pipeline. Resulting in M and a tables containing iModulon information. M table: Each column represents an independent component (IC), and each row contains the gene weights for each gene across each IC: Each column represents a sample, and each row contains the activity of each iModulon across all samples. (d) The M and a tables together with sample information were used as input for iModulon characterization using python package pymodulon. Components of iModulon containing both sRNA and genes were identified, and their activity under each experimental condition was visualized with bar plots.
