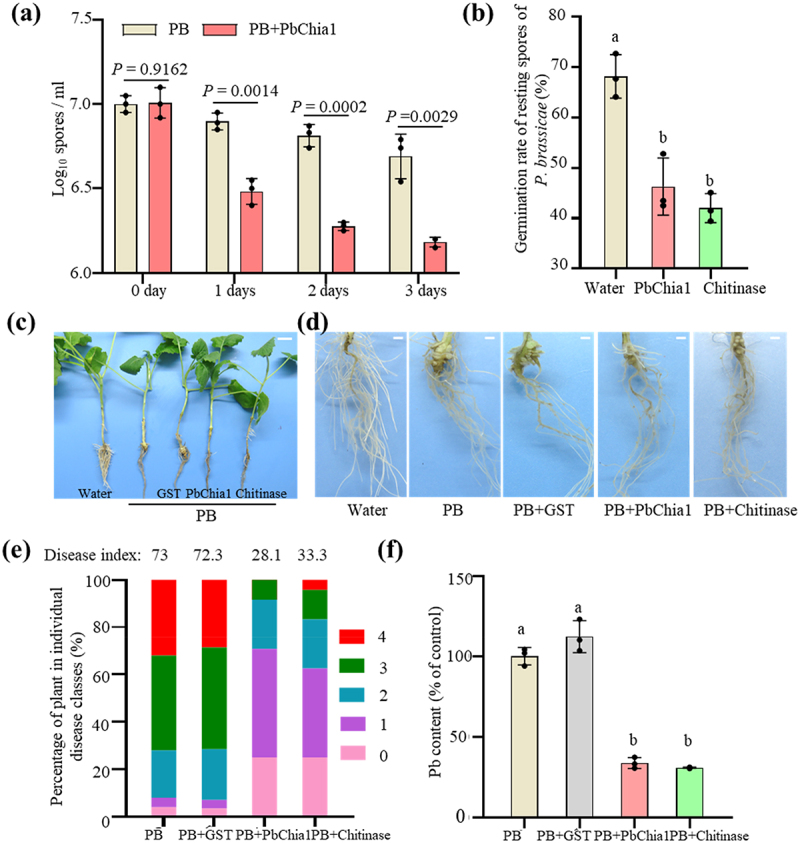
Figure 3.

Treatment of P. brassicae with purified PbChia1 protein. (a) Resting spores of P. brassicae were treated with 0.3 mg/mL PbChia1 protein for 3 d, and the number (a) and germination rate (b) were recorded. Resting spores stained with DAPI and the nucleus were observed under UV excitation. (c) and (d) Gall phenotype of rapeseed infected with P. brassicae for 30 d under different treatments. c shows the phenotype of the whole plants, bar = 1 cm. d shows the root phenotype, bar = 1 mm. (e) Phytopathological analysis of rapeseed inoculated with P. brassicae and PbChia1 protein. Percentages of plants in individual disease classes are shown. For each treatment, 24 to 28 rapeseed plants were analysed. (f) Pathogen DNA content was quantified by qPCR. Rapeseed actin gene was used as a reference gene to indicate the amount of plant, and P. brassicae actin gene was used as a reference gene to indicate the amount of pathogen. In a, b and f, One-way ANOVA with Kruskal-Wallis test. Data are mean ± s.D. n = 3 biological replicates. Different letters indicate significant differences (P < 0.05). All experiments in this figure were repeated three times with similar results.
