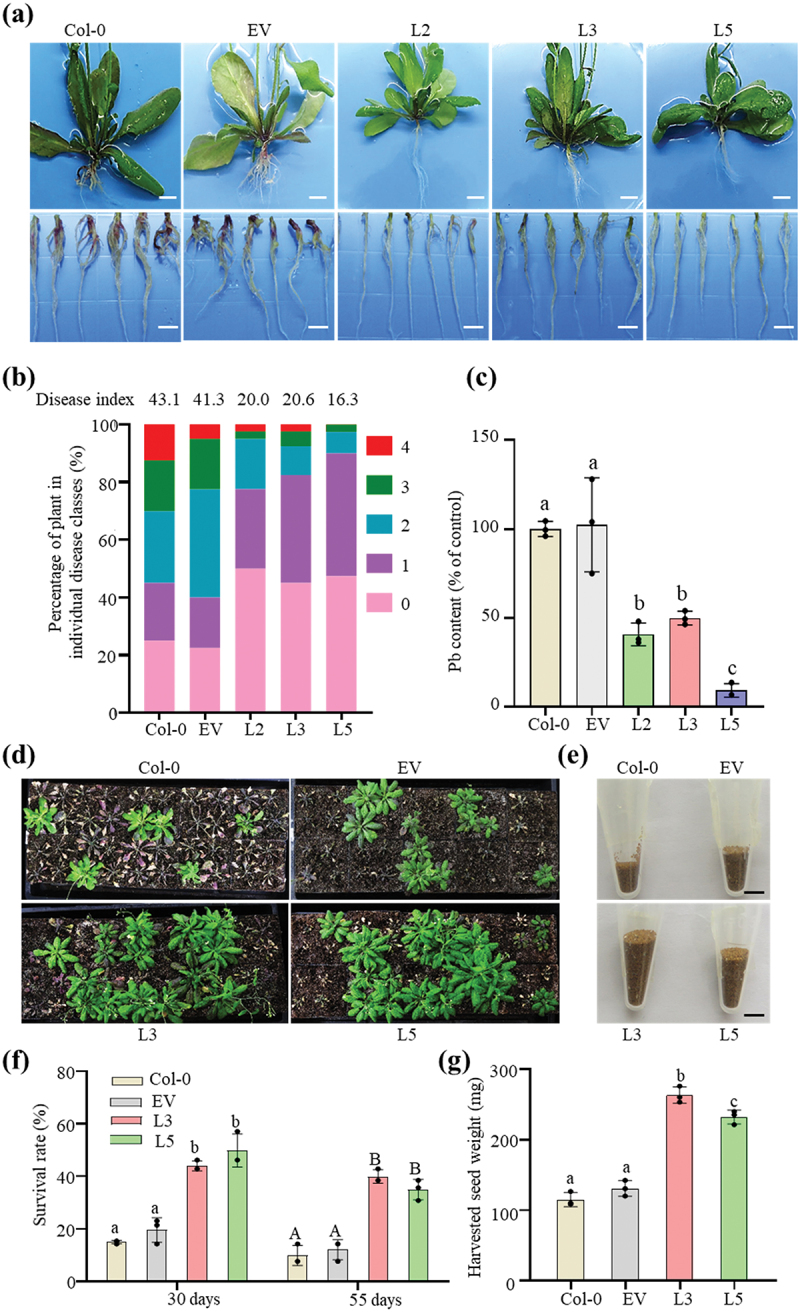
Figure 4.

Effect of PbChia1 overexpression in Arabidopsis on its resistance to P. brassicae. (a) Phenotype of PbChia1 overexpression transgenic plants inoculated with P. brassicae for 21 d, scale bar = 1 cm. (b) Phytopathological analysis of Col-0 and transgenic plants. The percentages of plants in individual disease classes are shown. For each treatment, 40 Arabidopsis plants were analysed. (c) qPCR was used to examine the pathogen content in Col-0 and transgenic plants infected with P. brassicae. Statistical analysis was performed by one-way ANOVA with Tukey’s test (significance set at P ≤ 0.05). Different letters (a, b and c) indicate significant differences. n = 4 biological replicates; data are shown as mean ± s.D. (d) Phenotype of Col-0 and transgenic plants inoculated with P. brassicae for 30 d. Each flat was grown with 40 plants, and the seeds of surviving plants were harvested into a tube (e). (f) Survival rates of Col-0 and PbChia1 transgenic plants infected with P. brassicae for 30 d and 55 d. A total of 40 plants were analysed. (g) Weights of seeds from Col-0 and transgenic plants inoculated with P. brassicae. Statistical analysis was performed by one-way ANOVA with Tukey’s test (significance set at P ≤ 0.05). Different letters represent significant differences. n = 3 biological replicates; data are shown as mean ± s.D. All experiments in this figure were repeated three times with similar results.
