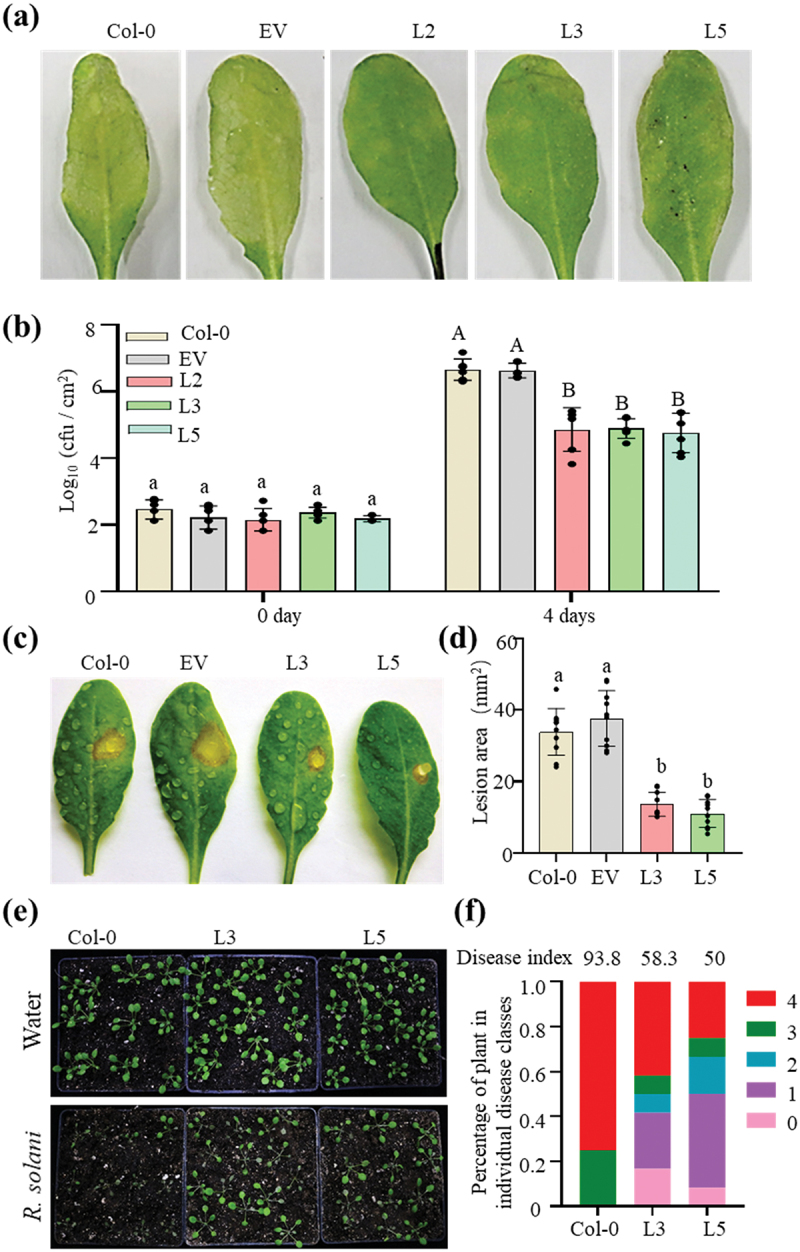
Figure 7.

PbChia1 transgenic lines have higher disease resistance to Pst DC3000, S. sclerotiorum and R. solani. (a) Phenotypes of PbChia1 transgenic lines and control plants inoculated with Pst DC3000 at 1 × 10⁶ cfu ml − 1 for 4 d. (b) Bacterial populations in PbChia1 transgenic lines and control plants on day 0 and day 5 after leaf infiltration with 1 × 10⁶ cfu ml − 1. Statistical analysis was performed by one-way ANOVA with Tukey’s test (significance set at P ≤ 0.05). Bacterial populations indicated by different letters are significantly different. n = 4 biological replicates. Data are shown as mean ± s.D. (c) Phenotypes of PbChia1 transgenic lines and control plants inoculated with S. sclerotiorum 1980 for 30 h. (d) Statistics of lesion area in PbChia1 transgenic lines inoculated with S. sclerotiorum 1980 for 30 h. n = 10 biological replicates. Data are shown as mean ± s.D. One-way ANOVA with Tukey’s test was used to analyse the differences. The same letters indicate no significant difference, P ≤ 0.05. (e) Phenotypes of PbChia1 transgenic lines and control plants inoculated with R. solani for 3 d. (f) Disease index statistics of PbChia1 transgenic lines and control plants inoculated with R. solani for 3 d, n = 12 biological replicates. Data are shown as mean ± s.D. One-way ANOVA with Kruskal-Wallis test was used to analyse the differences. The same letters show no significant difference, P ≤ 0.05.
