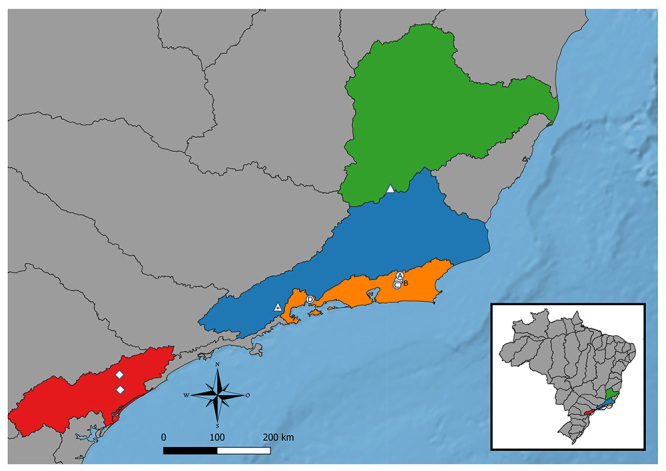
Figure 1 -. Map demonstrating the Deuterodon populations used in the phylogeny. Diamonds indicate populations of D. ribeirae, triangles indicate populations of D. giton (asterisk symbolizing sympatry with D. intermedius) and circles indicate populations of D. hastatus (letters representing the different cytotypes). In red the Ribeira de Iguape river basin, in blue the Paraíba do Sul river basin, in green the Doce river basin and in orange the coastal drainages of the state of Rio de Janeiro.

