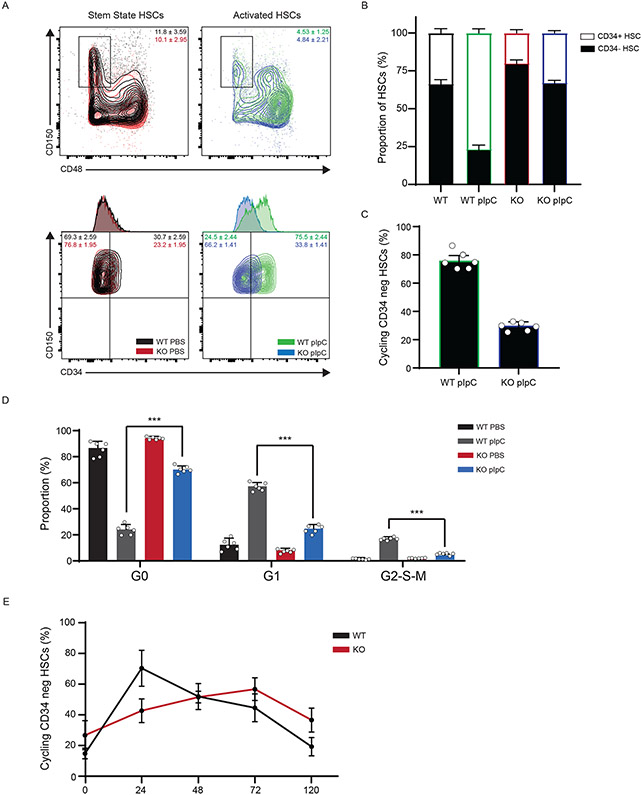
Figure 1: DNMT3A is important for a Stem State Switch upon Hematopoietic activation in vivo.
(A) Flow cytometry plot of WT and KO Long-Term HSCs (LT-HSCs, identified as CD150+ CD48− CD34− cells) before and after 24h polyinosinic:polycytidylic acid (pIpC) treatment. (B) Bar graph depicting the ratio of ST:LT-HSCs over time (n = 6 animals, mean values +/− SD). (C) % of cycling cells as measured by Ki-67 and Hoescht staining from LT-HSC after pIpC treatment (n = 6 animals, mean values +/− SD). (D) Cell cycle analysis by Ki-67 and Hoescht staining from LT-HSC after pIpC treatment (n = 6 animals, mean values +/− SD). (E) Time course of LT-HSCs in active cycle (G1/S/G2/M) by Ki-67 and Hoescht staining after pIpC treatment (n = 5 animals, mean values +/− SD). Panels B-E - unpaired t-test with Welch’s correction.

