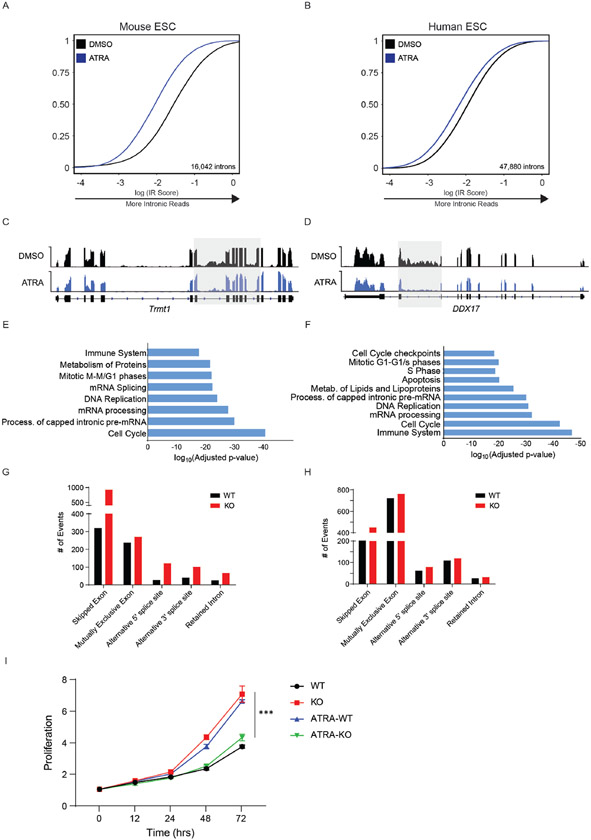
Extended Data Fig. 4. Impaired growth rate in KO mESCs after ATRA-stimulation.
(A) eCDF for 16,042 introns in WT murine ES cells (mESCs) after ATRA-stimulation for 24 hours (2 independent biological samples), p < 2.2x10⁻¹⁶). (B) eCDF for 47,880 introns in WT human ES cells (hESCs) after ATRA-stimulation for 6 hours (n = 2 biological replicates, p < 2.2x10⁻¹⁶). (C) RNA sequencing track of the Trmt1 locus in mESCs after ATRA-stimulation. (D) RNA sequencing track of the DDX17 locus in hESCs after ATRA-stimulation. (E) Gene Ontology analysis of genes displaying less intronic reads in ATRA-treated compared to DMSO-treated mESCS. (F) Gene Ontology analysis of genes displaying less intronic reads in ATRA-treated compared to DMSO-treated hESCs. (G) Changes in alternative splicing between WT and KO mouse Hematopoietic stem cells. (H) Changes in alternative splicing between WT and KO activated mouse embryonic stem cells. (I) Growth curves comparing proliferation rate of WT (black), KO (red), WT after ATRA-stimulation (ATRA-WT, blue), and KO after ATRA-stimulation (ATRA-KO, green) mESCs. N = 3 biologically independent samples and 2 independent experiments. Mean values +/− SD. Unpaired t-test with Welch’s correction, p < 0.01 = *** comparing ATRA-WT and ATRA-KO.

