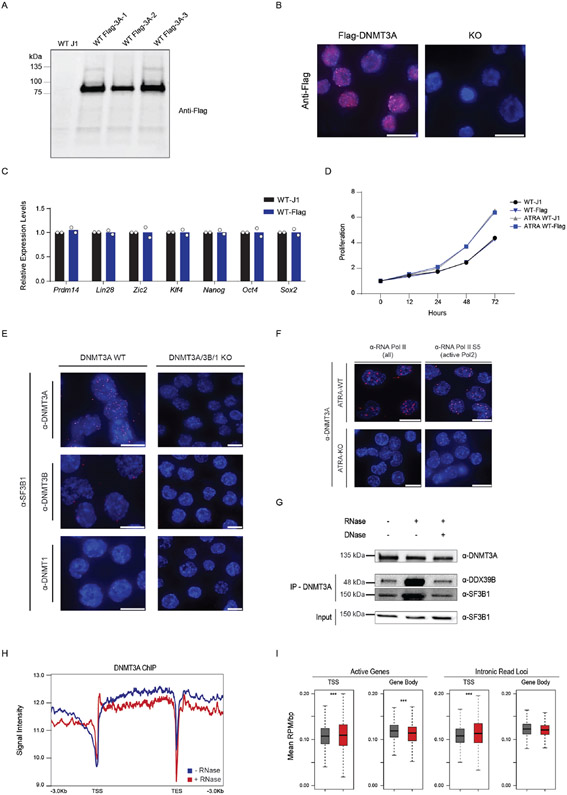
Extended Data Fig. 8. Endogenous-tagging of DNMT3A and In situ interaction between DNMT3A and Splicing Factors.
(A) Western blot after introducing a flag-tag at the c-terminus of endogenous Dnmt3a in mESCs. (B) Immunofluorescence using anti-Flag antibody in Flag-DNMT3A cells versus Dnmt3a KO mESCs. (C) Expression of pluripotency factors in Flag-tagged mESCs compared to WT parental J1 cells (n = 2 biologically independent samples and experiments, mean values +/− SD). (D) Growth curves comparing proliferation rate of WT J1 (black) and flag-DNMT3A mESCs (blue), before and after stimulation with ATRA (n = 2 biologically independent samples and experiments). (E) Proximity Ligation Assay (PLA) of DNMT3A and DNA methyltransferases. (F) PLA of DNMT3A and inactive and active RNA polymerase II in ATRA-WT and ATRA-KO mESCs. Scale bars on all immunofluorescence images represent 10μm. (G) Co-immunoprecipitation (Co-IP) of DNMT3A before and after DNase and RNase treatment. (H) Chromatin Immunoprecipitation and sequencing (ChIP-seq) of DNMT3A before and after treatment with RNase A. (I) Box plot showing mean density of DNMT3A ChIP signal at all active genes and intronic read loci (*** = p < 0.01, n = 2 biologically independent samples). Scale bars on all immunofluorescent images represent 10μm. 2 biologically independent experiments were performed for panels A-G.

