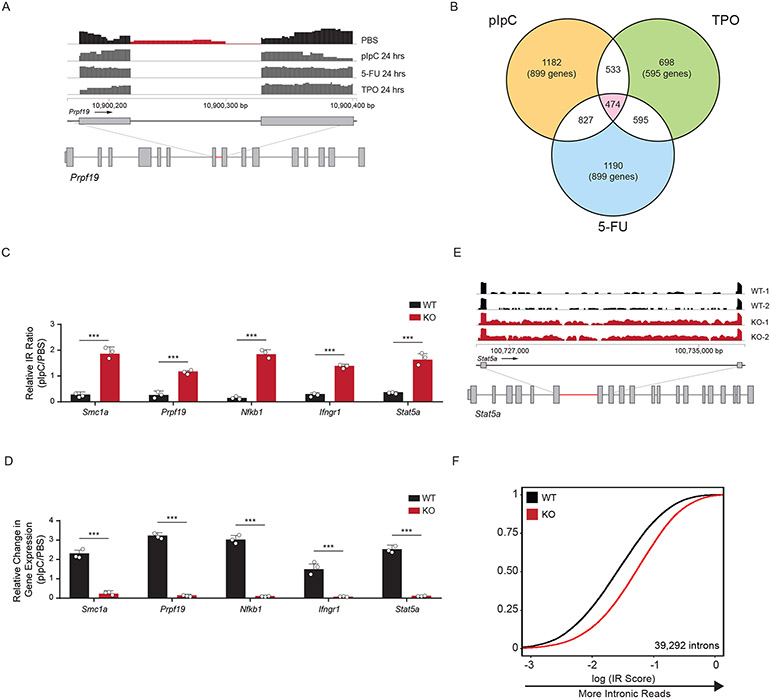
Figure 2: Activation of Hematopoietic Stem Cells involves upregulation of mRNA splicing.
(A) RNA sequencing track of the Prpf19 locus in PBS treated (black) and pIpC, 5-FU, or TPO treated (dark grey) murine HSCs. Region in red highlights intronic reads (IR) in PBS-treated compared to stimuli-treated mice (n = 4 animals per group). (B) Venn-diagram showing the number of overlapping IR loci between different activation stimuli (pIpC, TPO, and 5-FU) compared to control (PBS). (C, D) RT-qPCR validation of relative IR (top) and changes in gene expression (bottom) in WT and KO HSCs. IR ratios were normalized to β-actin (n = 5 animals per experiment, 3 independent experiments, mean values +/− SD, unpaired t-test with Welch’s correction, *** p < 0.001). (E) RNA sequencing track of the Stat5a locus in WT (black) and KO (red) mouse HSCs. Highlighted region in red is expanded to show increased IR in KO compared to WT HSCs. (F) eCDF for 39,292 introns in WT and KO HSCs (n = 5 animals per experiment, 2 independent experiments) showing greater intronic reads in KO compared to WT HSCs (curve shifting to the right indicates more intronic reads).

