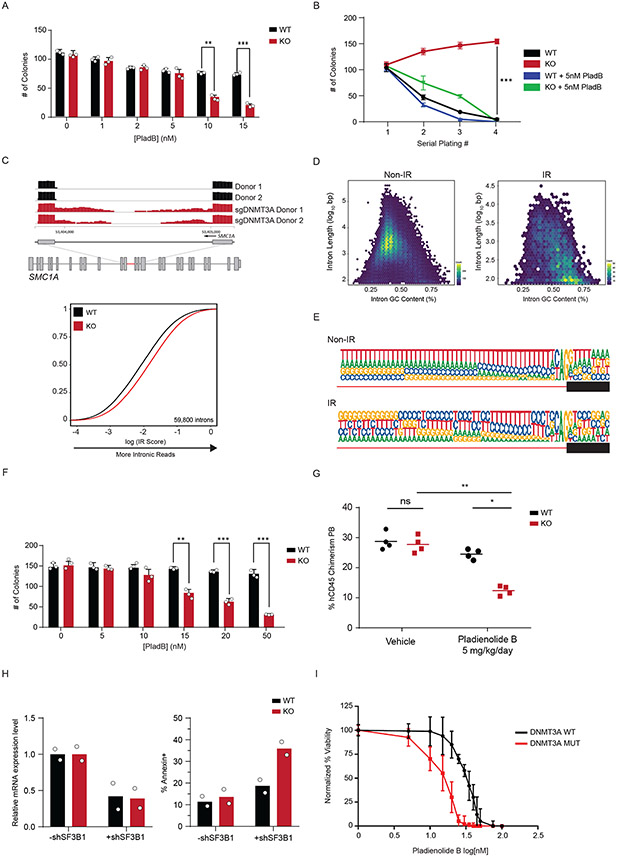
Figure 6: Loss of DNMT3A in Human Hematopoietic cells reveals a therapeutic vulnerability to spliceosome inhibition.
(A) Colony formation assay of Dnmt3a WT and KO murine hematopoietic stem and progenitor (LSK) cells treated with indicated amounts of Pladienolide B (PladB) (n = 3 animals and 2 independent experiments, mean values +/− SD, unpaired t-test with Welch’s correction). (B) Serial replating colony formation assay of murine Dnmt3a WT and KO stem cells (n = 3 animals and independent experiments of Dnmt3a WT (black), Dnmt3a KO (red), Dnmt3a WT + PladB (5nM) (blue), Dnmt3a KO + PladB (5nM) (green)). p < 0.05 = **, p < 0.01 = ***. Mean values +/− SD are shown, unpaired t-test with Welch’s correction. (C) top RNA sequencing track of the SMC1A locus in Cas9 (black) and sgDNMT3A (red) CD34+ HSPCs from 2 patients. Highlighted region in red is expanded to show increased intronic reads in sgDNMT3A compared to Cas9 HSPCs. bottom eCDF for 59,800 introns in DNMT3A WT and KO human CD34+ HSPCs (n = 2 donors). (D) Hexbin plot showing relative abundance of mis-spliced introns based on length (y-axis) and GC-content (x-axis) of non-IR (left) and IR (right) loci in human sgDNMT3A versus Cas9 Donor HSPCs. The total number of intron count contained within each hex is indicated by its colour (n = 2 donors). The colours range from blue to yellow. A yellow hexbin represents the highest number of introns with a given length and GC content. Non-IR targets were predominantly long and low in GC content, while IR targets are short and high in GC content. (E) The 3′ splice site motif of loci with intronic reads (IR) vs loci without intronic reads (Non-IR) in sgDNMT3A human donor CD34+ HSPCs versus Cas9 HSPCs (n = 2 donors). (F) Colony formation assay of Cas9 and sgDNMT3A donor CD34+ HSPCs after treatment with indicated amounts of PladB. n = 3 donors and experiments, mean values +/− SD. Unpaired t-test with Welch’s correction. (G) Percent human CD45 chimerism in the peripheral blood of recipient NSG mice with either WT or KO K562 cells four days after the last of five treatments with vehicle or PladB (5mg/kg/day) (n = 4 animals per group, mean values ± SD; two-way ANOVA with Turkey’s multiple comparison tests; * p<0.05, ** p<0.01). (H) Bar plot of mRNA expression levels (left) and apoptosis (right) in WT and KO isogenic K562 cells after shRNA-mediated knockdown of SF3B1. (I) AnnexinV apoptosis assay comparing DNMT3A WT (black, n = 10) vs. DNMT3A MUTANT (red, n = 20) AML patients after treatment with indicated concentrations of PladB. N = 30 biologically independent donor cells per PladB concentration, mean values +/− SD. Patient mutation profiles are in Supplementary Table 8. Unpaired t-test with Welch’s correction was used to test significance.

