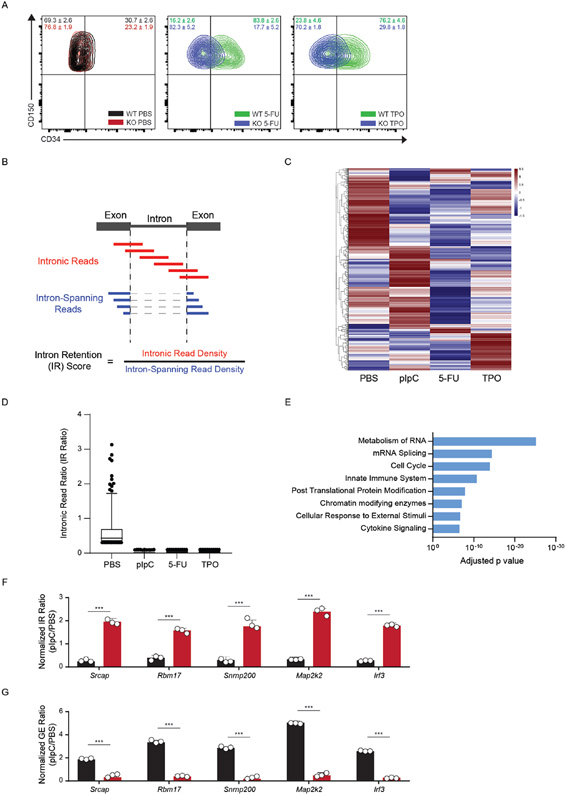
Extended Data Fig. 2. Enhanced Splicing Efficiency in Activated HSCs.
(A) Flow cytometry plot of CD150+ HSCs gated for CD34 after activation of WT and KO stem cells using 5-Flurouracil (5-FU) and Thrombopoietin (TPO) (n = 4 mice per group). (B) Schematic of Intronic Read (IR) ratio/score. Recently used in (Bowling and Wang, et al. Cell 2021). (C) Heatmap depicting IR ratio for each locus in PBS-treated vs. stimuli-treated mouse HSCs (n = 4 mice per replicate, 2 replicates per treatment). Red lines indicate presence of intronic reads at those loci. Raw data available in Extended Data Table 1. (D) Bar plot showing IR ratio for 437 common loci displayed greater splicing efficiency after exposure to stimuli. N = 4 animals and 2 independent experiments. Mean values +/− SD. Middle line represents mean, unpaired t-test with Welch’s correction). (E) Gene ontology enrichment analysis of commonly spliced genes displaying less intronic reads (IR) in activated stem cells after treatment with pIpC, 5-FU, and TPO. (F, G) RT-qPCR validation of relative IR (top) and changes gene expression (bottom) in WT and KO HSCs after activation with pIpC. IR ratios were normalized to β-actin (n = 4 animals and 3 independent experiments. Data shows mean values +/− SD, unpaired t-test with Welch’s correction).

