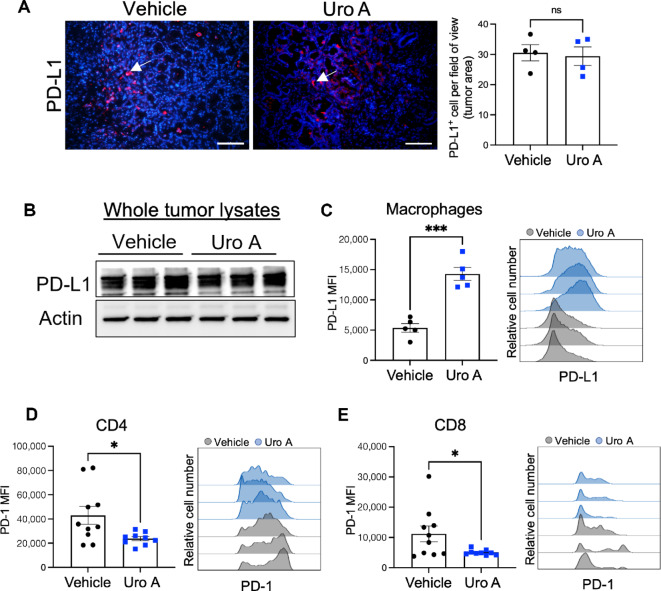
FIGURE 4.
PD-1/PD-L1 expression in the PDAC TME with Uro A treatment. A, Immunofluorescence-based histologic analysis depicting PD-L1–positive cells within pancreatic tumor sections harvested from vehicle or Uro A-treated PKT mice. Mean of positive cells per field of view within the tumor area for each mouse is shown in adjacent plot, n = 4 mice per group. B, Western blot analysis demonstrating PD-L1 protein expression in whole pancreatic tumor lysates from vehicle- or Uro A-treated PKT mice. C, Flow cytometric analysis of PD-L1 expression in the macrophage population with representative PD-L1 histogram overlay of vehicle- and Uro A-treated PKT mice (right). Flow cytometric analysis of PD-1 expression on CD4+ T cells (D) and CD8+ T cells (E) with representative PD-1 histogram overlay of vehicle- and Uro A-treated groups (right) of pancreatic tumors from PKT mice. Individual datapoints with mean ± SEM are shown and compared by two-tailed unpaired t test. *, P < 0.05; ***, P < 0.001; ns, P > 0.05; MFI, mean fluorescence intensity.

