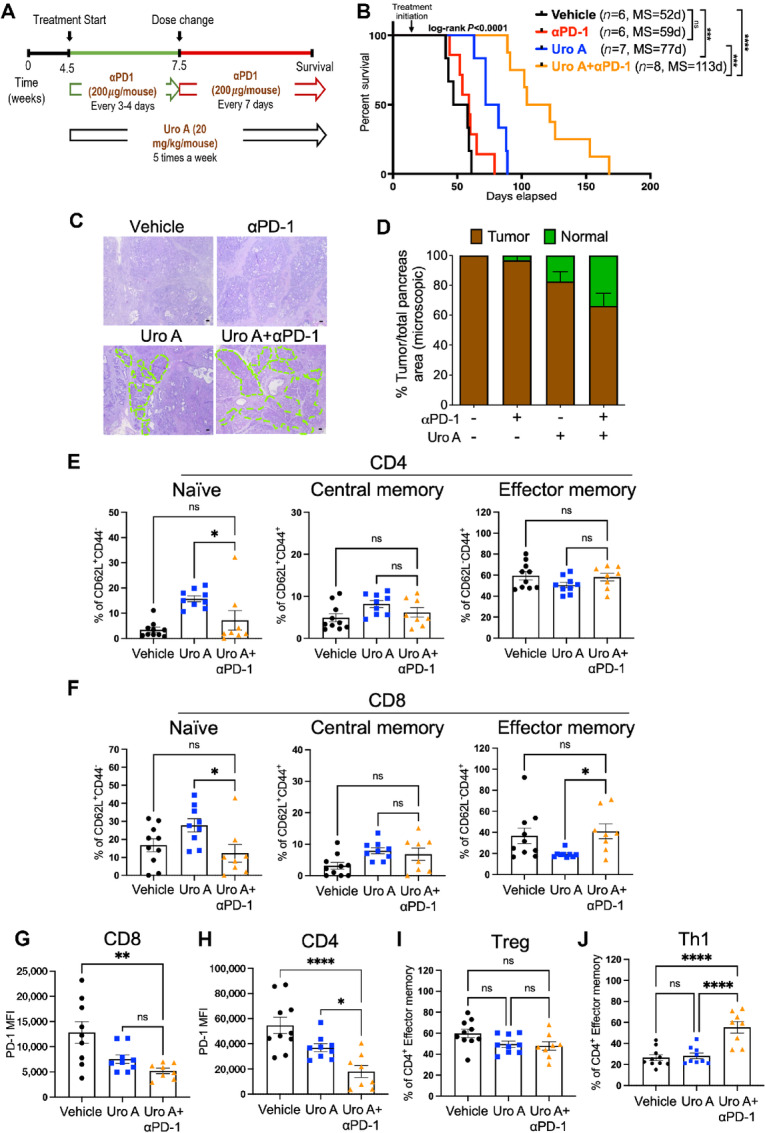
FIGURE 5.

Addition of αPD-1 blockade to Uro A treatment further decreases PDAC tumor burden and improves overall survival in PKT mice. A, Schematic representation of PKT mice treated with vehicle, Uro A, or Uro A in combination with aPD-1. B, Kaplan–Meier plot and log-rank test analysis showing superior survival of PKT mice treated with Uro A in combination with aPD-1 when compared with all other groups. C, Representative H&E-stained tumor sections after 3 weeks of drug treatment depicting significant presence of normal pancreatic architecture (highlighted in green) in PKT mice treated with combination therapy of Uro A and αPD-1 as compared with other treatment cohorts (scale bar = 50 μm). D, Percentage of tumor area (brown bar) relative to the normal pancreas (green bar) quantified within the whole pancreas, by capturing multiple fields of view in lower magnification. E–J, Flow cytometric assessment of the tumor-infiltrating adaptive immune compartment in mice treated with vehicle, Uro A (same mice cohort used in previous figures) or Uro A+aPD-1 depicting frequency of CD4+ (E) and CD8+ (F) T cells naïve, central memory, and effector memory populations. PD-1 MFI expression in CD8+ T cells (G) and PD-1 MFI expression in CD4+ T cells (H). Flow cytometric analysis of tumor-infiltrating effector memory CD4+ T cells showing frequency of Tregs (I), and Th1 (J) cells in mice treated with vehicle, Uro A or Uro A+aPD-1. Individual datapoints with mean ± SEM are shown and compared by one-way ANOVA test. *, P < 0.05; **, P < 0.01; ***, P < 0.001; ****, P < 0.0001; ns, P > 0.05.
