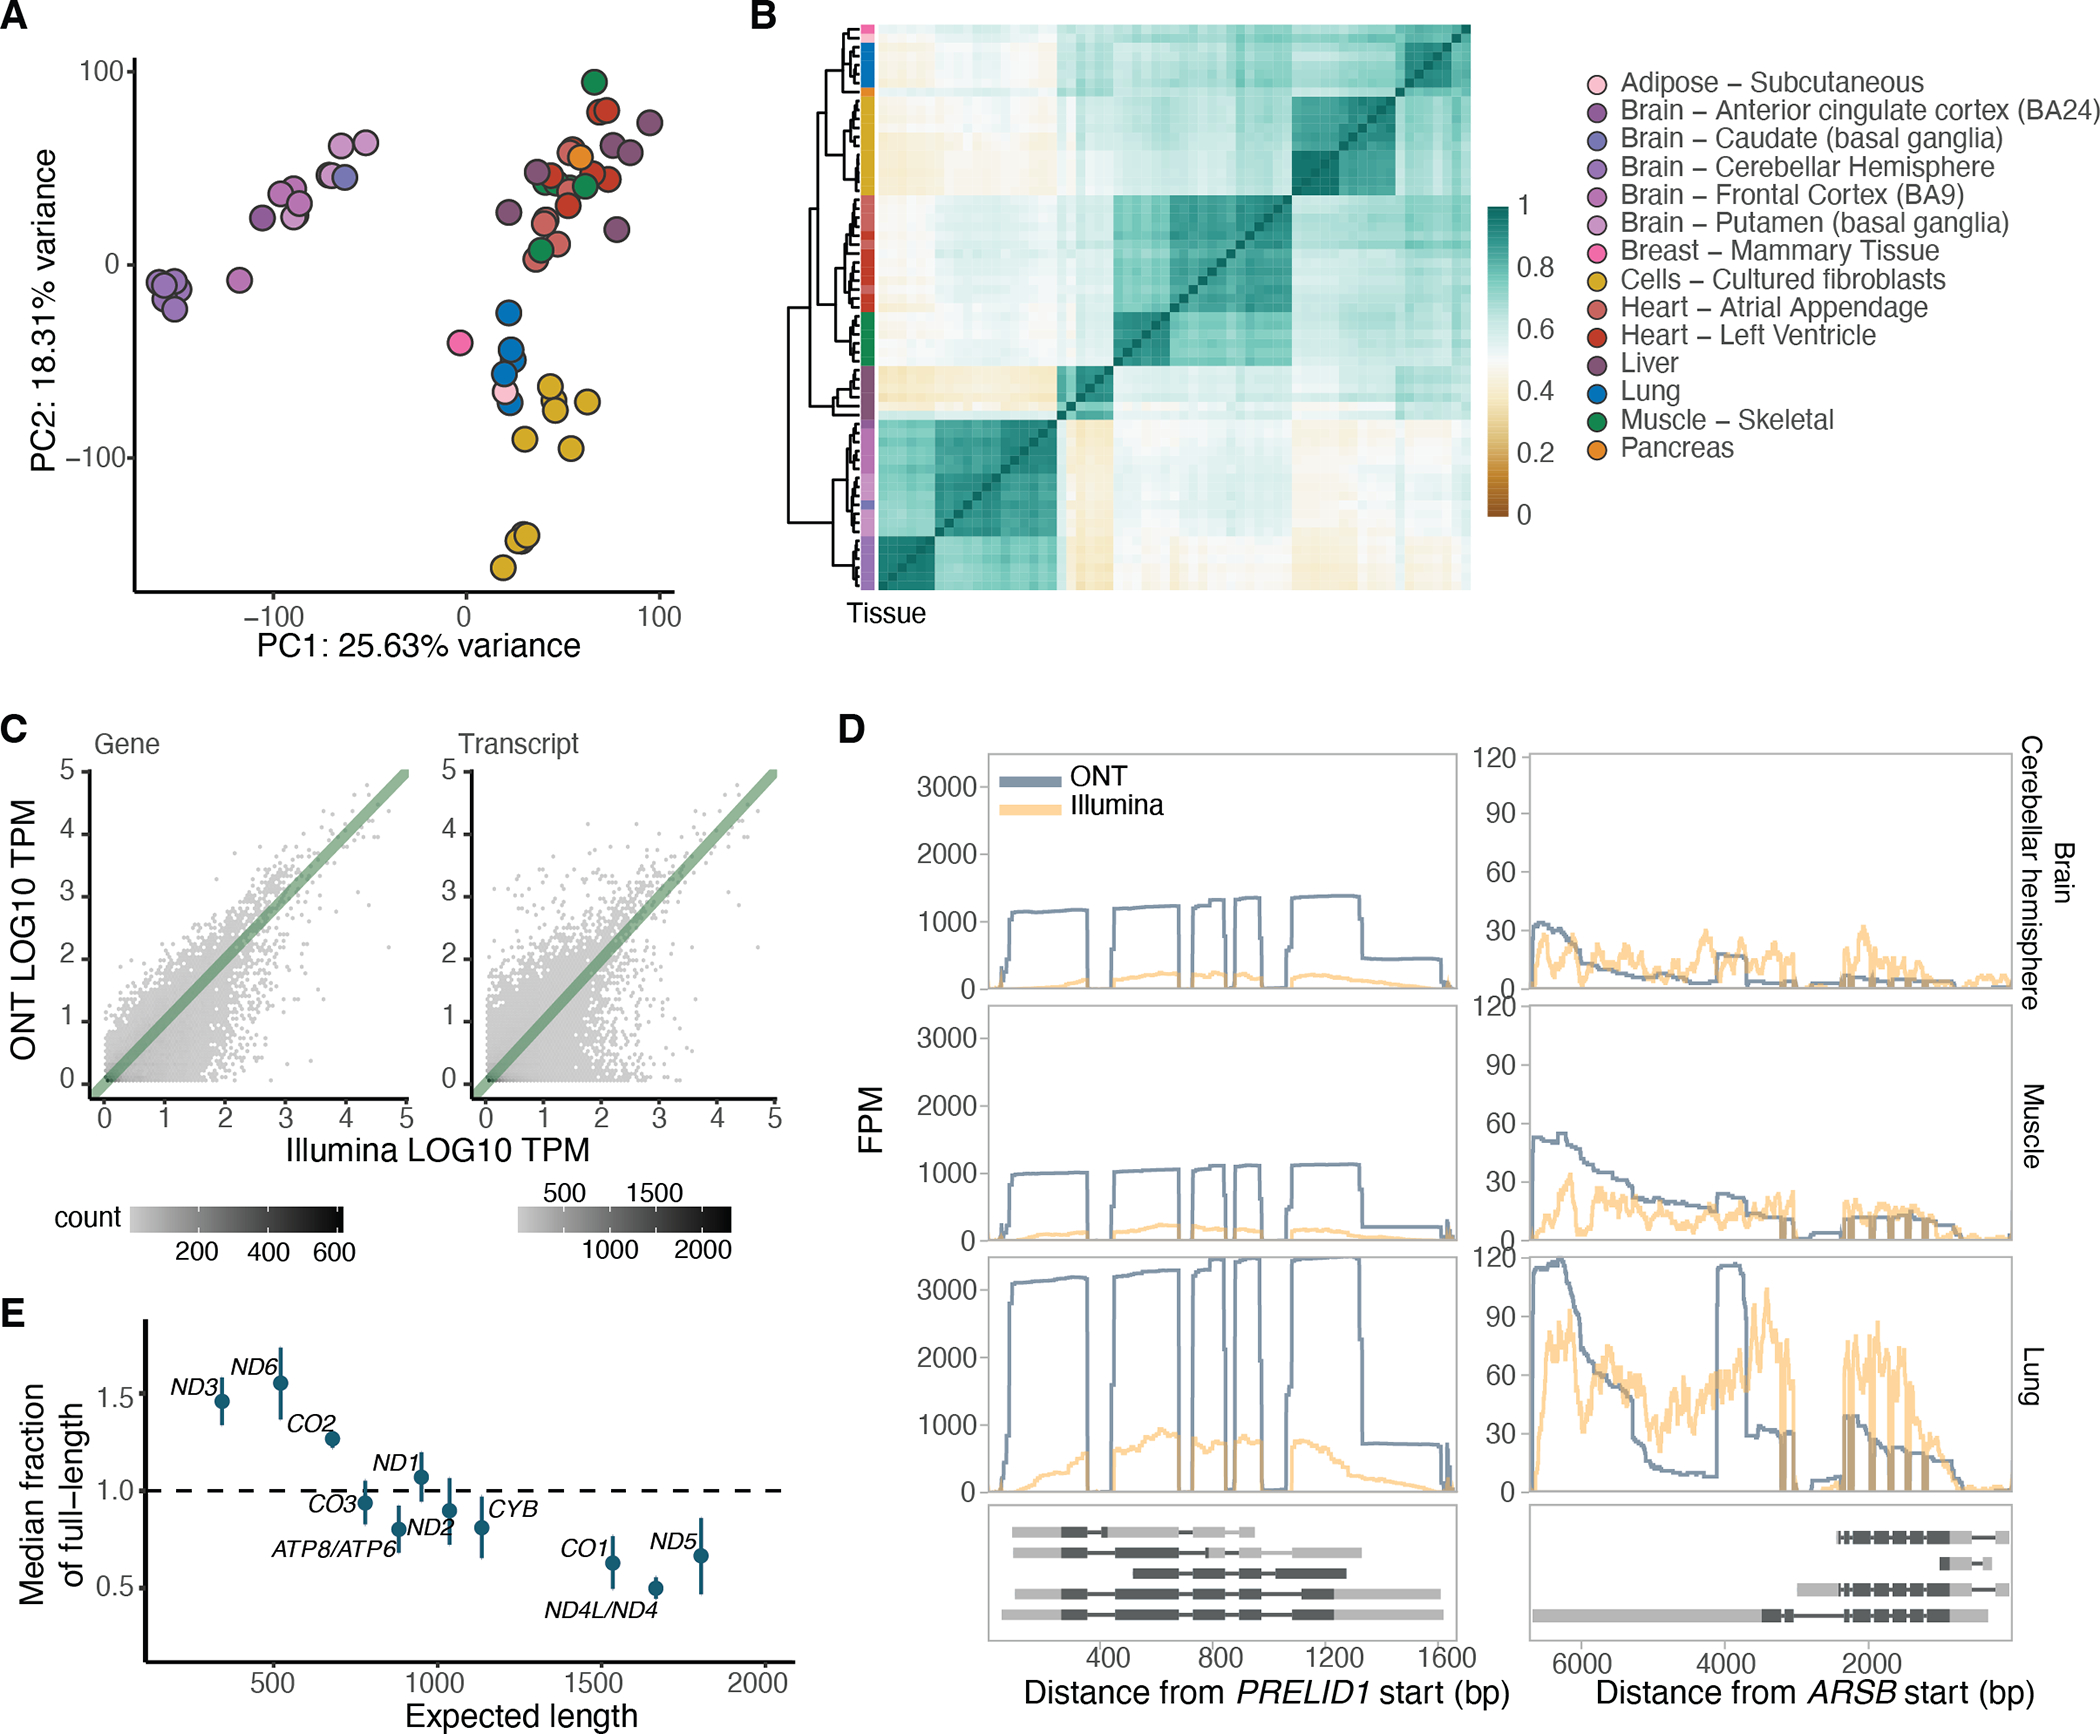
Figure 1: Overview and quality control of the dataset.

A) Principal component analysis of samples with replicates merged, without K562 cell lines and without PTBP1 knockdown samples, based on GENCODE transcript expression (>3 TPM in >5 samples). B) Hierarchical clustering of samples based on correlation of transcript expression (as in A), using Euclidean distance. C) Example of gene and transcript expression correlation between Illumina and ONT in the muscle tissue of GTEX-1LVA9. D) Two examples of genes displaying low correlation between ONT and Illumina. PRELID1 was better captured by ONT than Illumina, while ARSB had 3’ bias when assayed by ONT. They are shown across three different tissues and all protein-coding transcripts are plotted below. FPM: Fragments per million. E) Relationship between the expected transcript read length and the fraction of observed nanopore poly(A) RNA reads over the expected full length. Labels are for mitochondrial genes without the MT prefix. The transcript median was calculated per sample, and plotted is the median across all samples . Error bars represent standard deviation.
