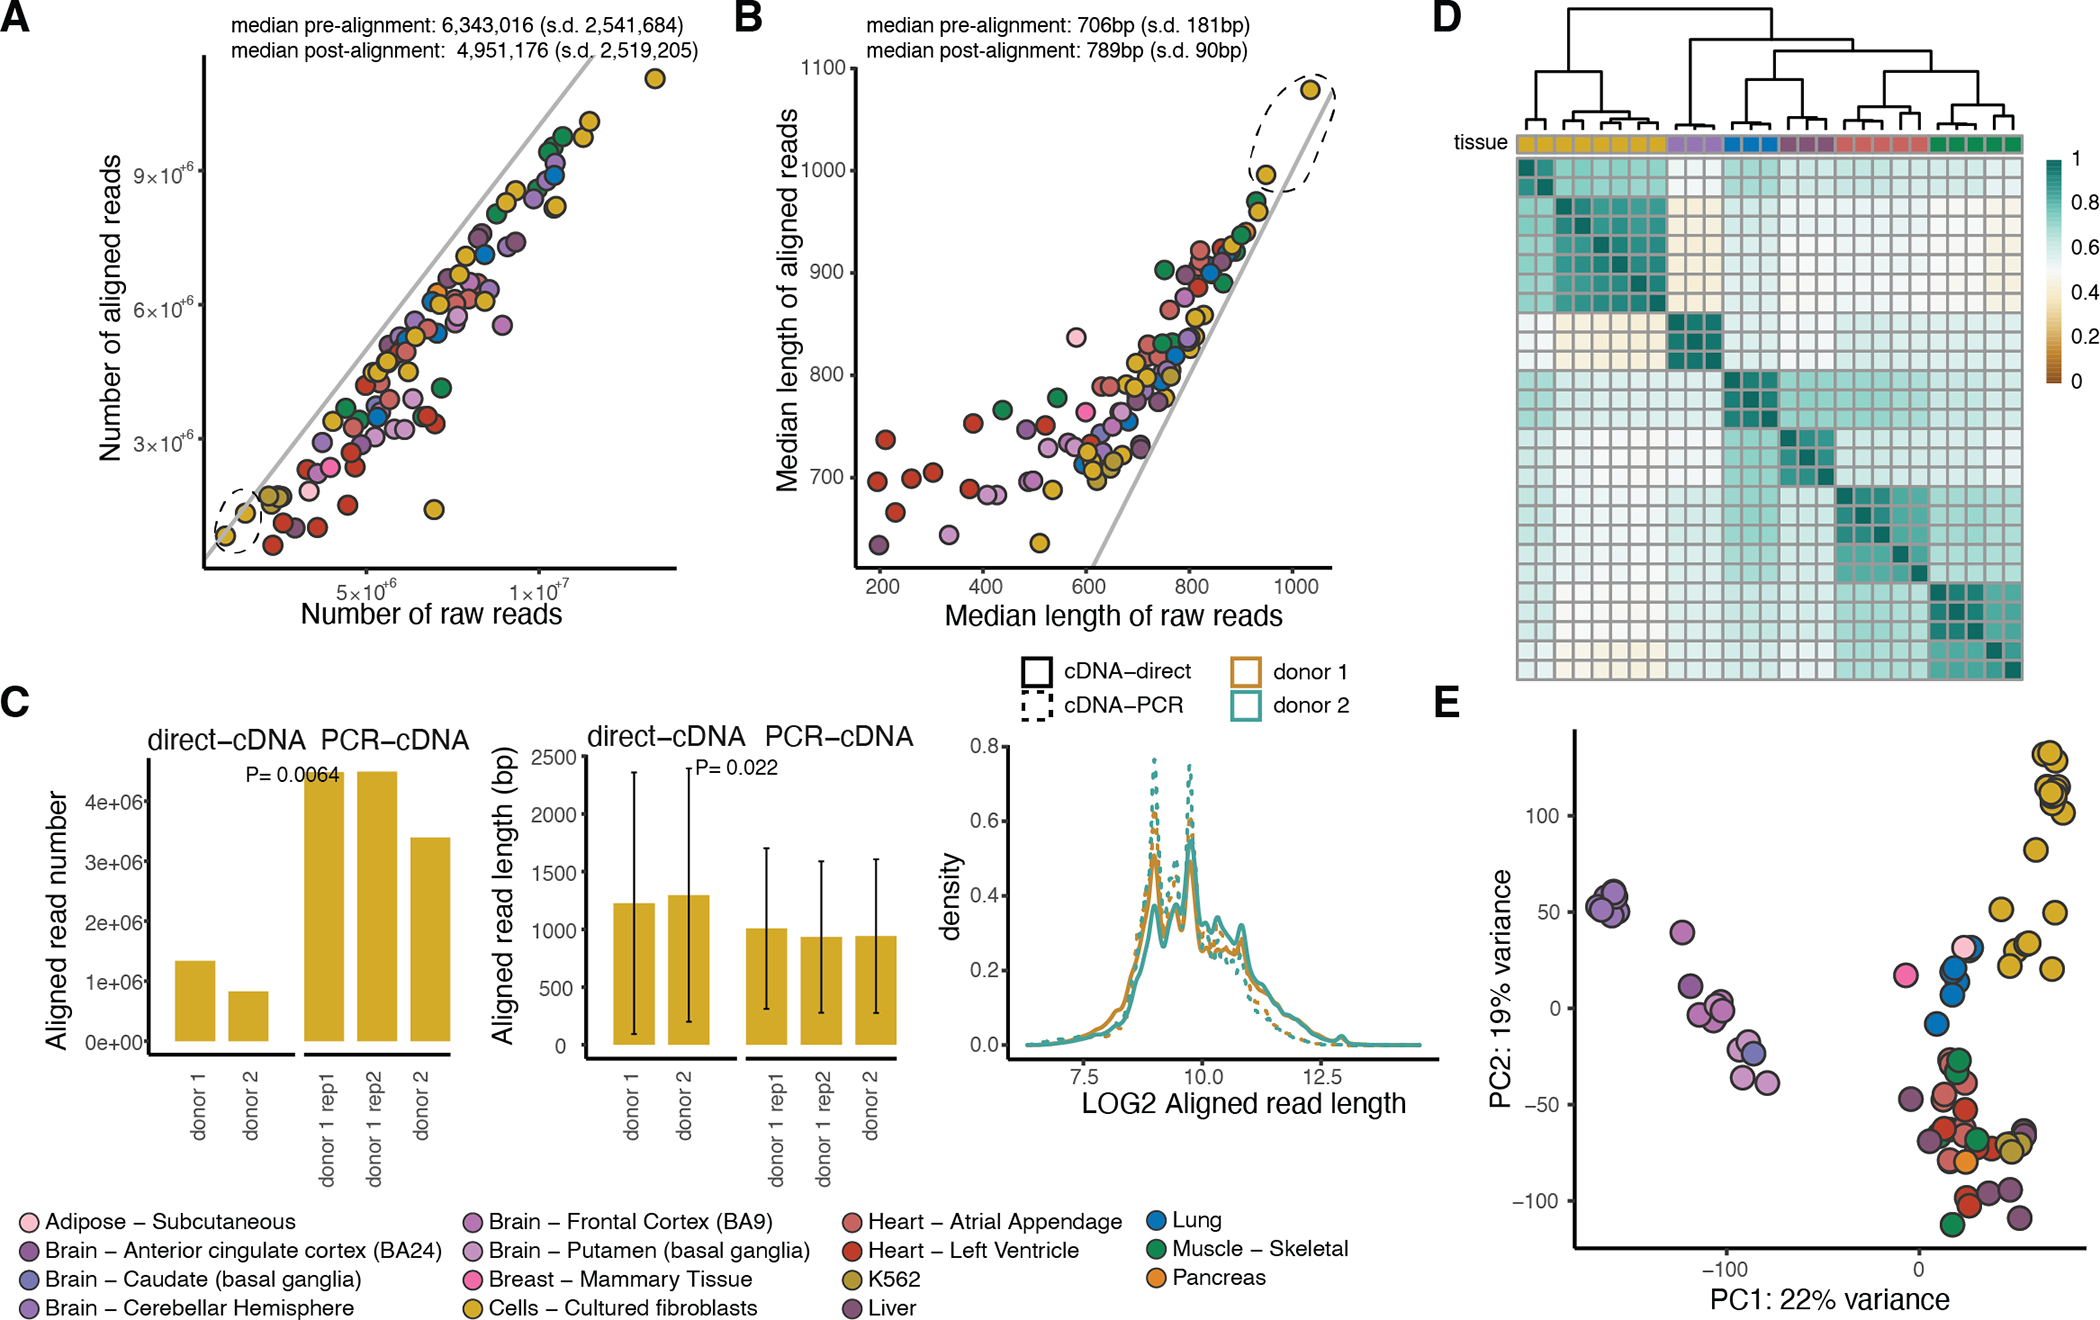
Extended Figure 1: Quality control of the dataset.

A) Number and B) median length of raw and aligned reads per sample. The diagonal lines correspond to intercept = 0. With the dashed black circle, we highlight the two samples sequenced using the direct-cDNA technology. C) Read number and read length in two fibroblast cell line samples (one of which was sequenced in replicate) that were sequenced using both the direct-cDNA and the PCR-cDNA protocol for 48 hours. P-values were calculated using a two-sided t-test. Error bars: standard deviation from the mean. D) Hierarchical clustering using Euclidean distance for replicate samples aligned to GENCODE for transcripts with expression above 3 TPM in at least 5 samples. E) Principal component analysis using all 88 samples aligned to GENCODE (v26) for transcripts with expression above 3 TPM in at least 5 samples.
