
Extended Figure 2: Comparison between ONT and Illumina gene expression.
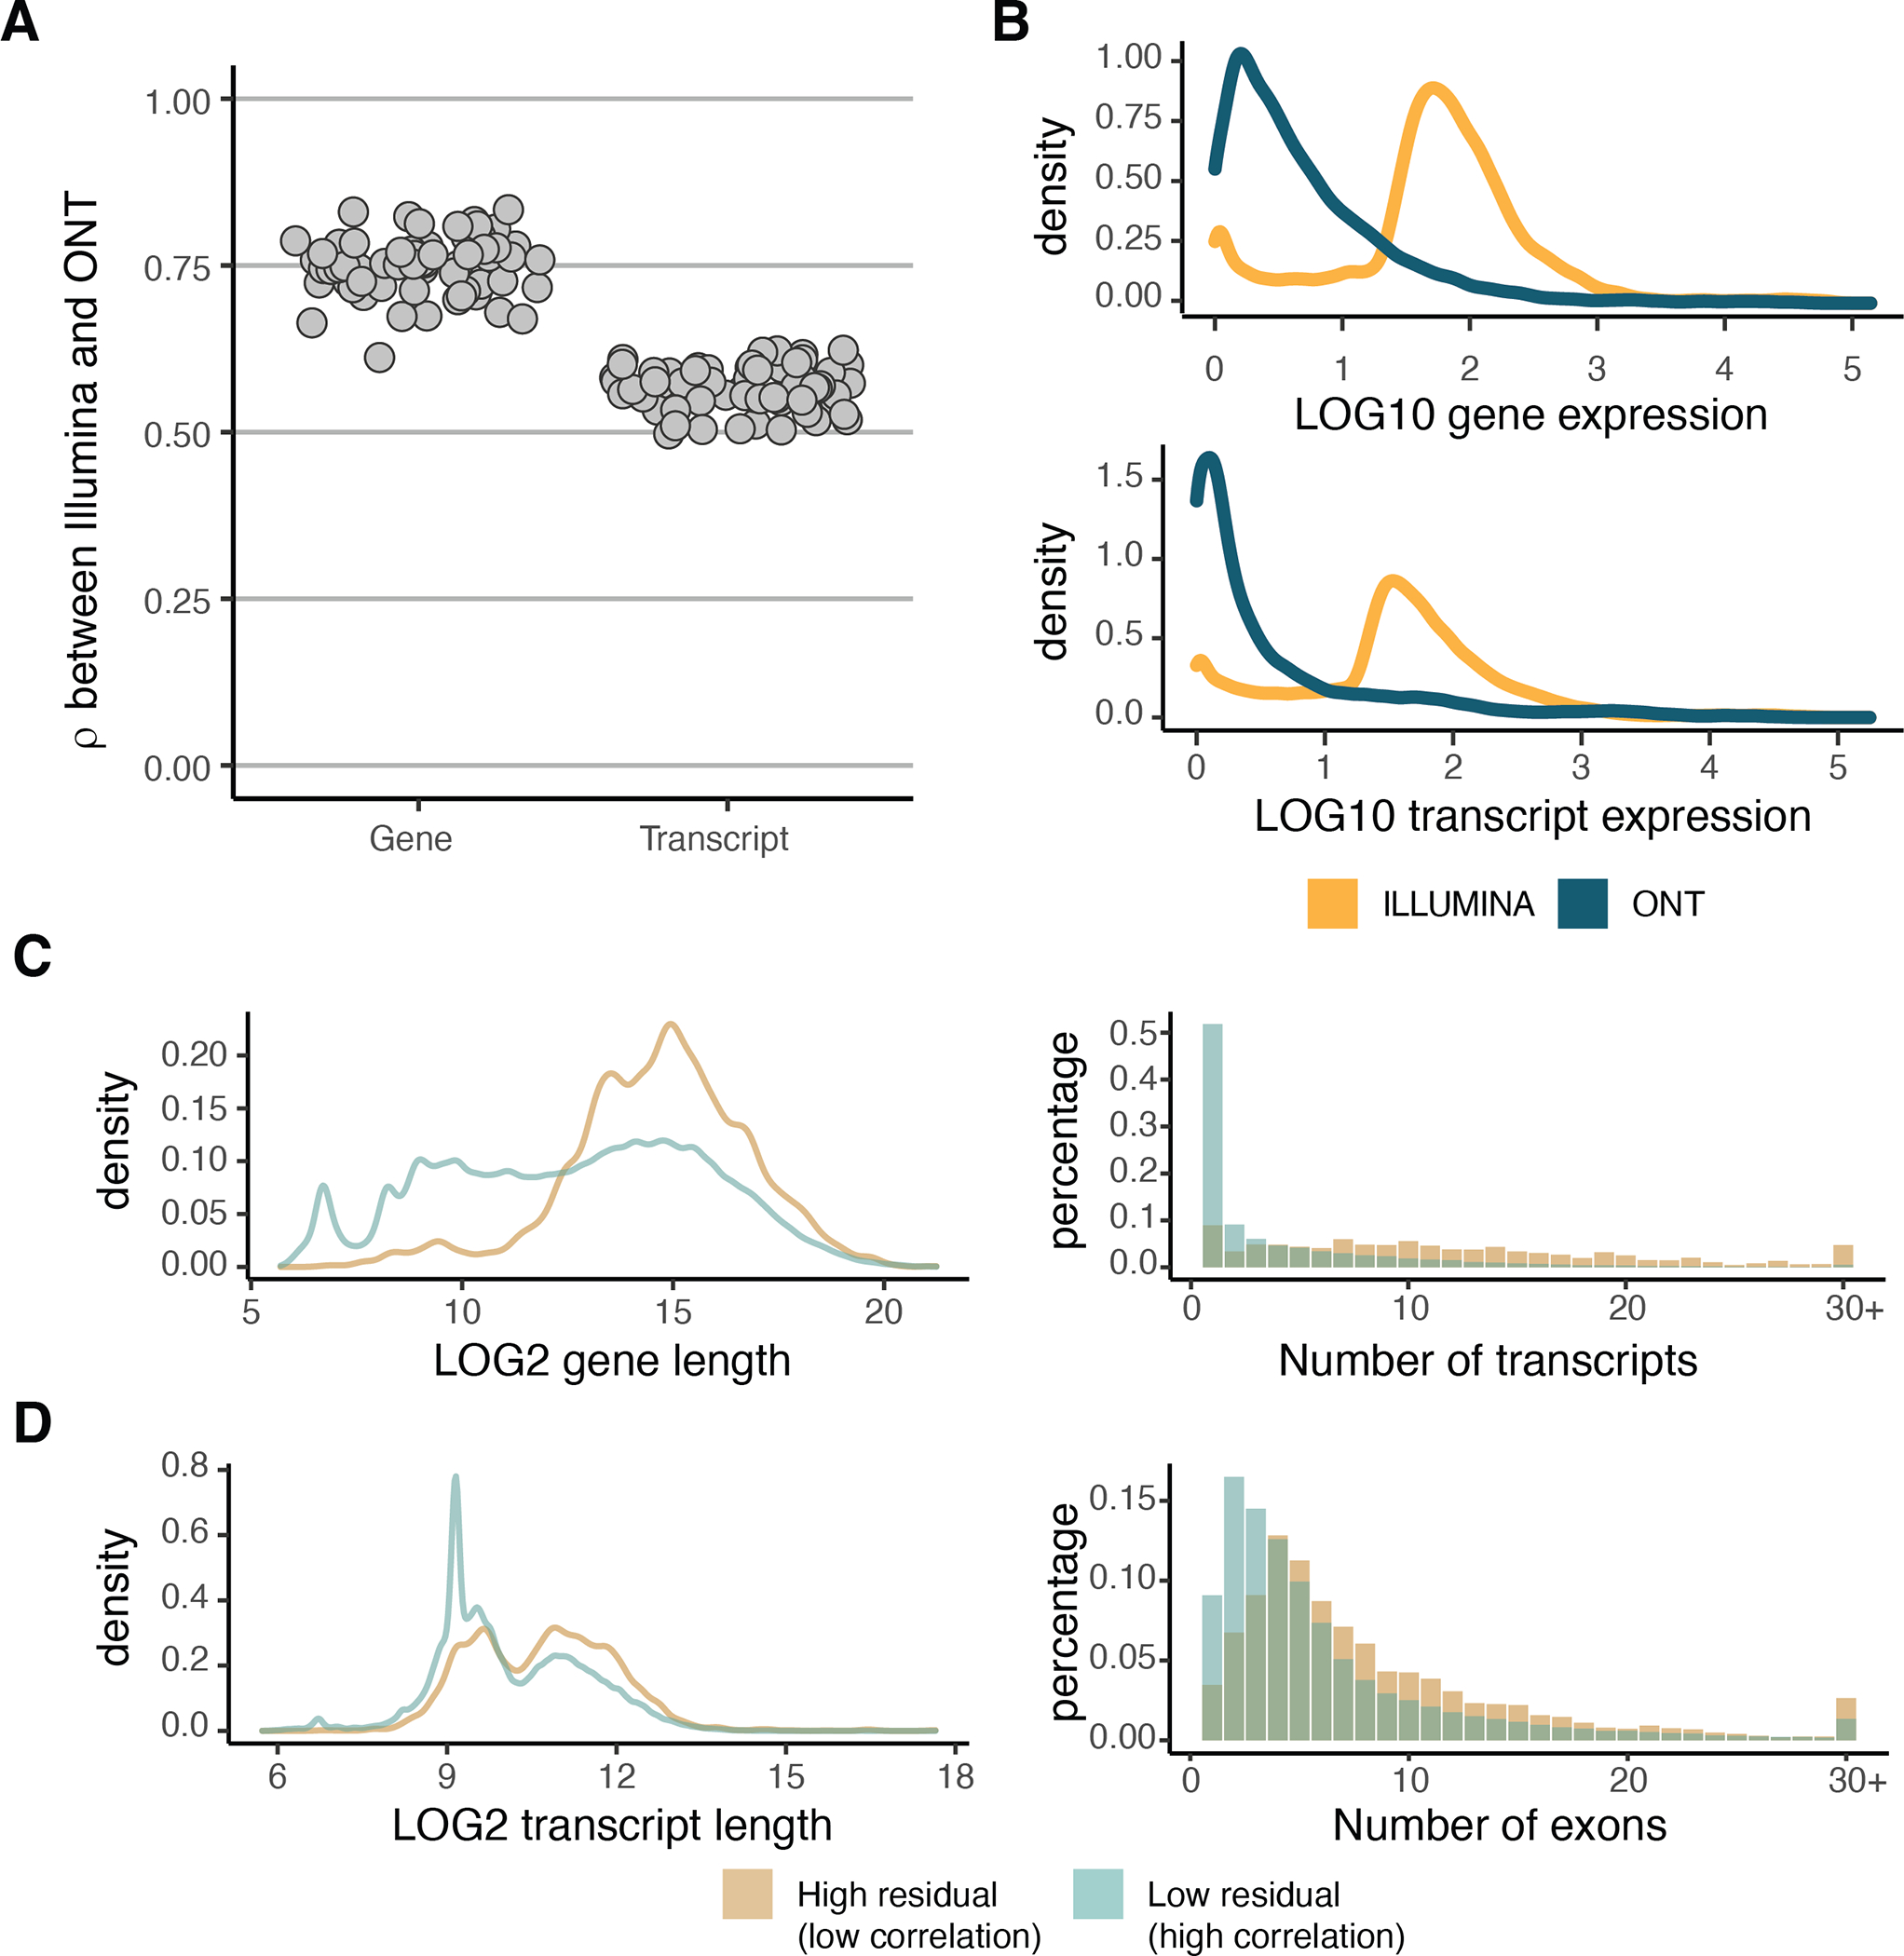
A) Correlation between the transcriptome of each sample quantified by ONT and by Illumina sequencing technologies. B) Normalized gene and transcript expression for high residual (|residual| > 1) genes and transcripts retrieved from the Spearman correlation analysis. C) Characteristics of genes and D) transcripts with high or low residuals with respect to gene/transcript length, number of transcripts per gene and number of exons per transcript.