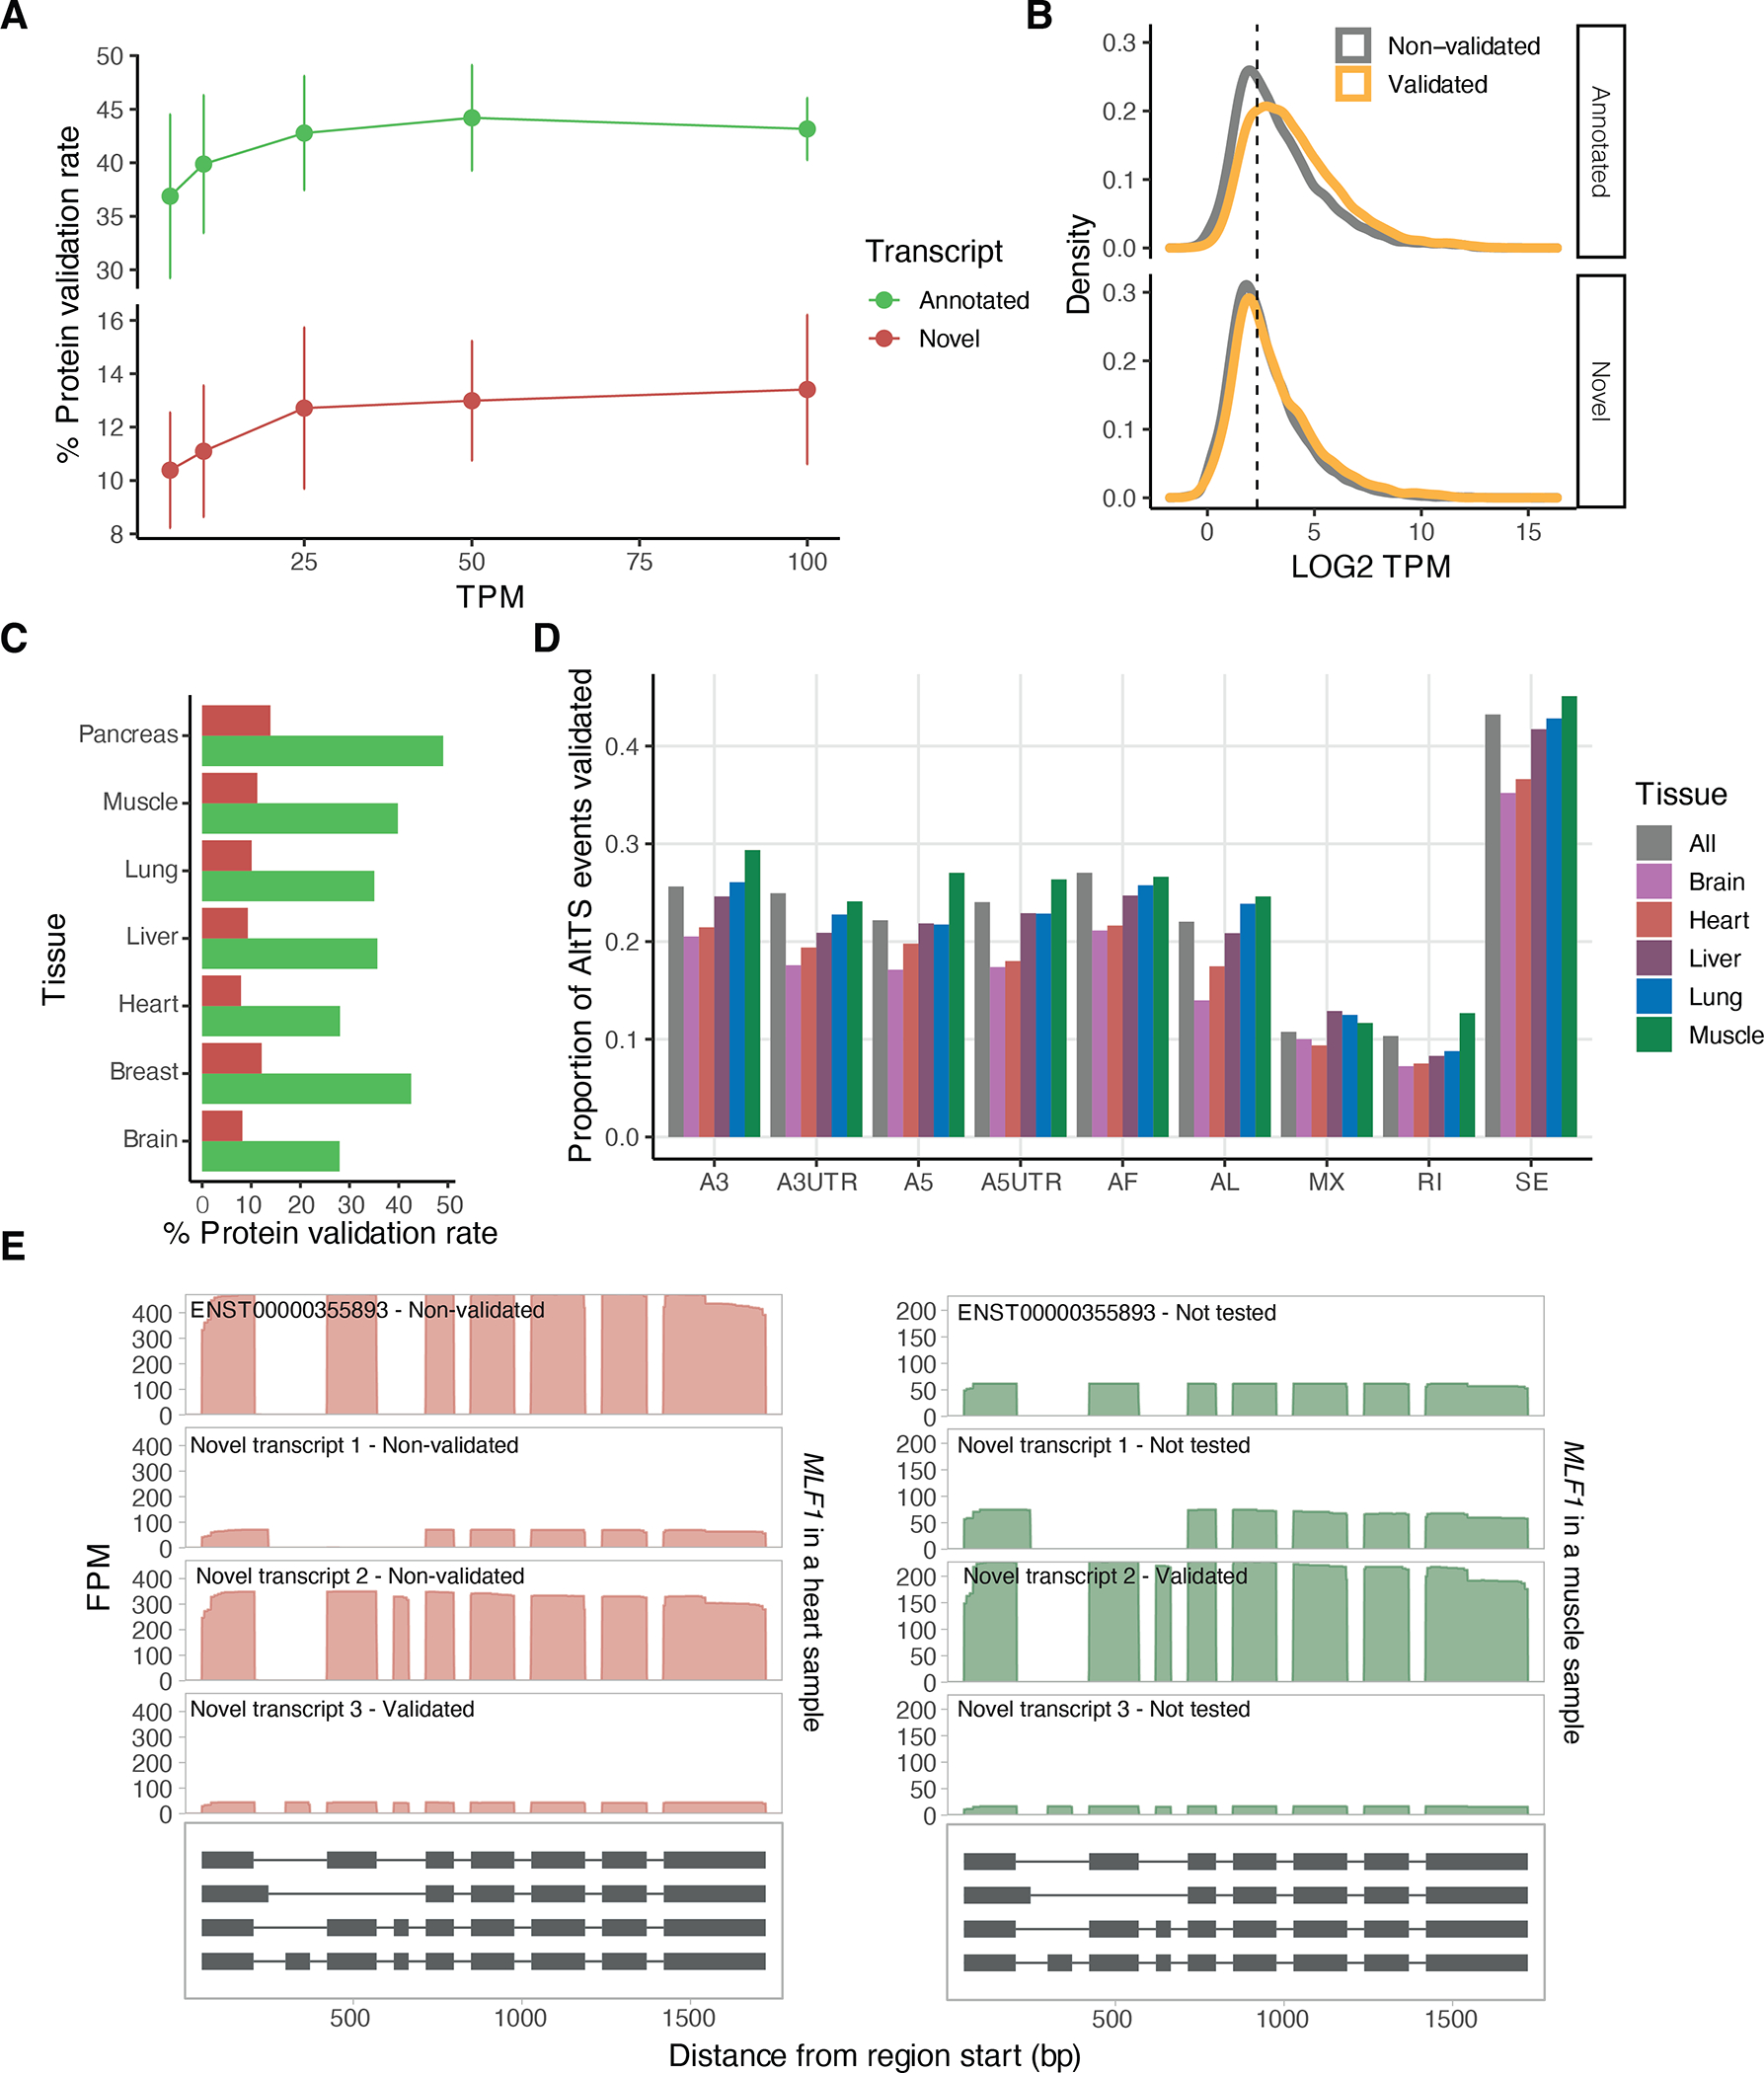
Extended Figure 5: Protein validation analysis of transcripts from matched tissues.

A) Percentage of validated transcripts at the protein level using mass spectrometry for different TPM thresholds. Each point represents the mean across assayed tissues and error bars represent the standard deviation. B) Mean expression per tissue with over one sample (lung, liver, heart, muscle and brain) of annotated and novel transcripts stratified by their validation status. The vertical line denotes the 5TPM threshold used. C) Percentage of validated transcripts at the protein level using mass spectrometry per primary tissue. D) Proportion of the AltTS events validated per tissue. E) MLF1 is an example of a gene with multiple highly-expressed transcripts across both muscle and heart tissues with a different transcript validated in each tissue. A3: alternative 3’ splice site; A5: alternative 5’ splice site; AF: alternative first exon; AL: alternative last exon; A3UTR: alternative 3’ end; A5UTR: alternative 5’ end; MX: mutually exclusive exons; RI: retained intron; SE: skipped exon.
