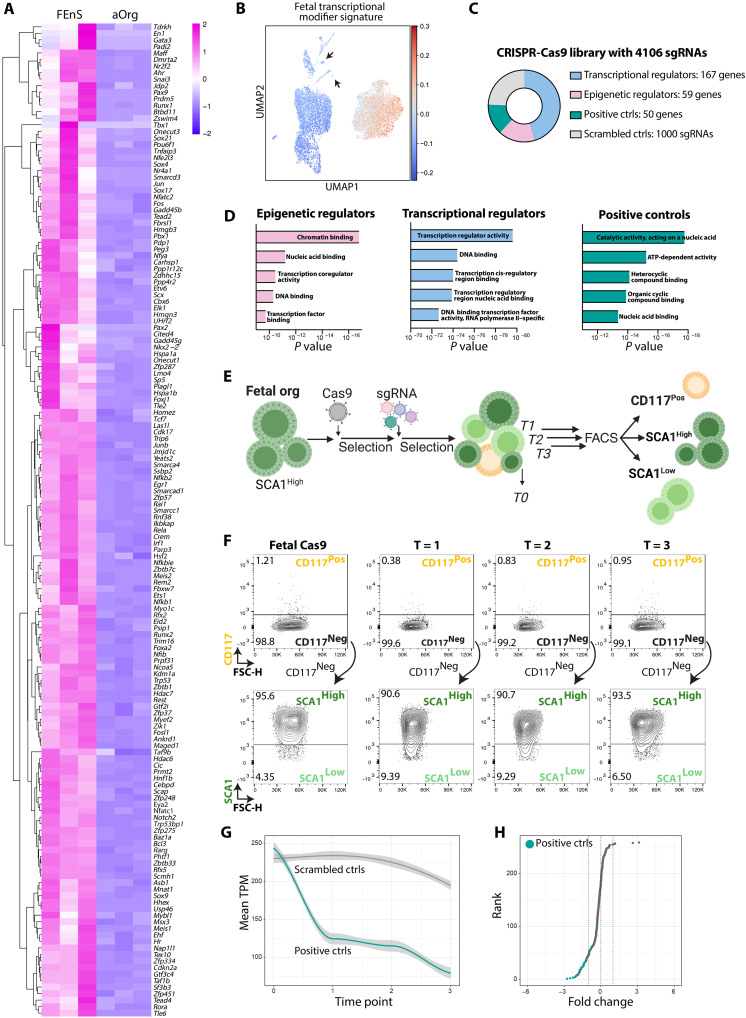
Fig. 2. Implementation of a targeted CRISPR-Cas9 screen in FEnS.
(A) Heatmap of transcription factors and epigenetic regulators differentially expressed between FEnS and aOrgs (n = 3, log2 FC > 1, FDR < 0.05) (see fig. S2A). (B) UMAP plot showing relative enrichment of fetal transcriptional modifiers in FEnS and aOrgs (see Fig.S2B). Arrows indicate adult-like fetal clusters I and II. (C) Composition of the targeted CRISPR-Cas9 sgRNA library. (D) Enriched biological process Gene Ontology terms from indicated categories of the genes included in the sgRNA library: epigenetic regulators, transcriptional regulators, and positive controls. x axis: P value. (E) Illustration of the experimental flow of the CRISPR-Cas9 screen in FEnS. (F) Flow cytometry contour plots showing CD117 and SCA1 expression in parental FEnS expressing Cas9, and the expression at the three analytical time points of the screen. Three populations were sorted at each time point: CD117Pos, CD117NegSCA1High, and CD117NegSCA1Low. (G) Normalized transcripts per million (TPM) of scrambled control nontargeting sgRNAs (gray) and positive controls targeting essential genes (teal) during the three time points of the screen. (H) Rank score plot of control sgRNAs based on their FC enrichment in T = 1 versus T = 0. Positive controls targeting essential genes are shown in teal. ATP, adenosine 5´-triphosphate.

