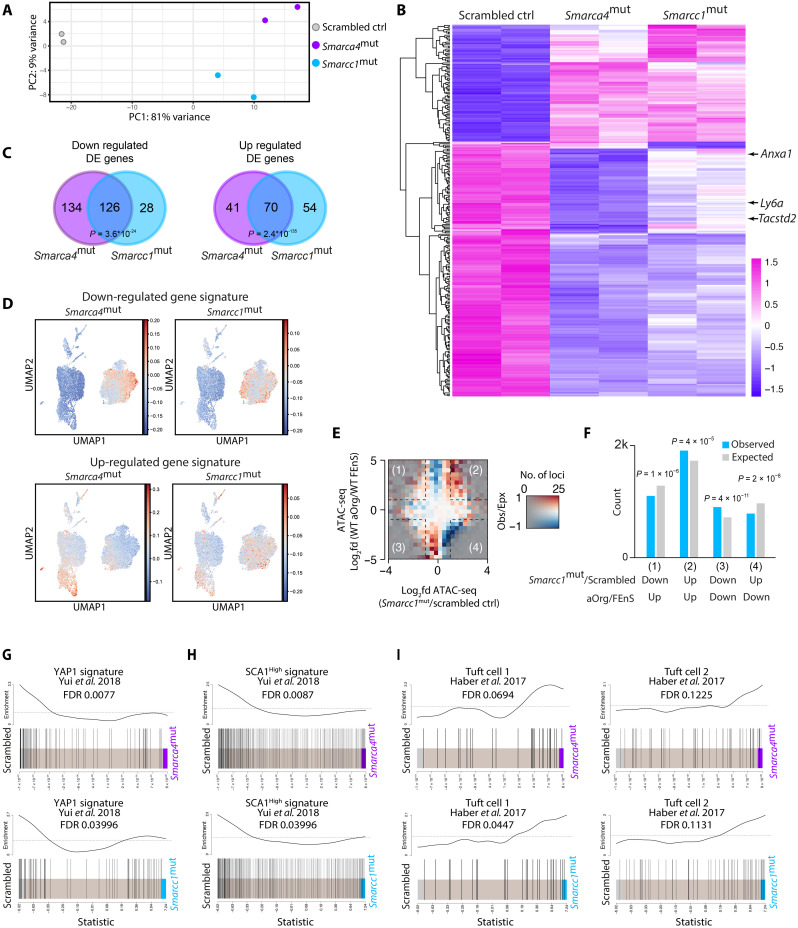
Fig. 5. Mutations in Smarca4 or Smarcc1 induce similar maturation-associated transcriptional changes.
(A) PCA plot of RNA-seq data from scrambled control, Smarca4mut, and Smarcc1mut fetal organoids in biological duplicates. (B) Heatmap of DEGs between scrambled control, Smarca4mut, and Smarcc1mut fetal organoids in biological duplicates (LFC >0.5; FDR <0.05). Expression of fetal-like markers Ly6a (SCA1), Anxa1, and Tacstd2 (TROP2) is indicated by arrows. (C) Venn diagram of DEGs in Smarca4mut and Smarcc1mut fetal organoids compared to scrambled control (log2FC >0.5; FDR <0.05). Fisher’s exact test was used to calculate significance. (D) UMAP showing relative enrichment of genes down-regulated (top) and up-regulated (bottom) (LFC >0.5; FDR <0.05) in Smarca4mut (left) and Smarcc1mut (right) organoids compared to scrambled controls on scRNAseq data from wild-type (WT) FEnS and aOrgs (see Fig. 1B). (E) Matrix of the log2 fold differences in observed versus expected occurrences of loci in Smarcc1mut organoids versus scrambled control fetal organoids (x axis) compared to assay for transposase-accessible chromatin sequencing (ATAC-seq) regions in WT control fetal and aOrgs (y axis) at enhancer regions (n = 57,353). Opacity is adjusted according to the number of loci with a given combination of ATAC-seq changes. The red color indicates more changes than expected, and the blue color indicates fewer changes than expected. (F) Bar plot of observed counts (blue) and expected counts (gray) of changed loci in the four squares of the matrix plot was shown in (E). P values from Bonferroni-corrected chi-square tests are indicated. (G and H) Gene set enrichment analysis (GSEA) of the YAP1-driven signature from the growth of aOrg in collagen versus Matrigel (G) or SCA1High versus SCA1Low cells from an in vivo model of experimental colitis (H) from Yui et al. (17), enriched in the transcriptome of the scrambled control line versus Smarca4mut (top) or Smarcc1mut (bottom). FDR value for negative enrichment in the mutant lines is indicated. (I) GSEA of two tuft cell gene sets from Haber et al. (31), enriched in the transcriptome of scrambled control lines versus Smarca4mut (top) or Smarcc1mut (bottom). FDR value for positive enrichment in the mutant lines is indicated.

