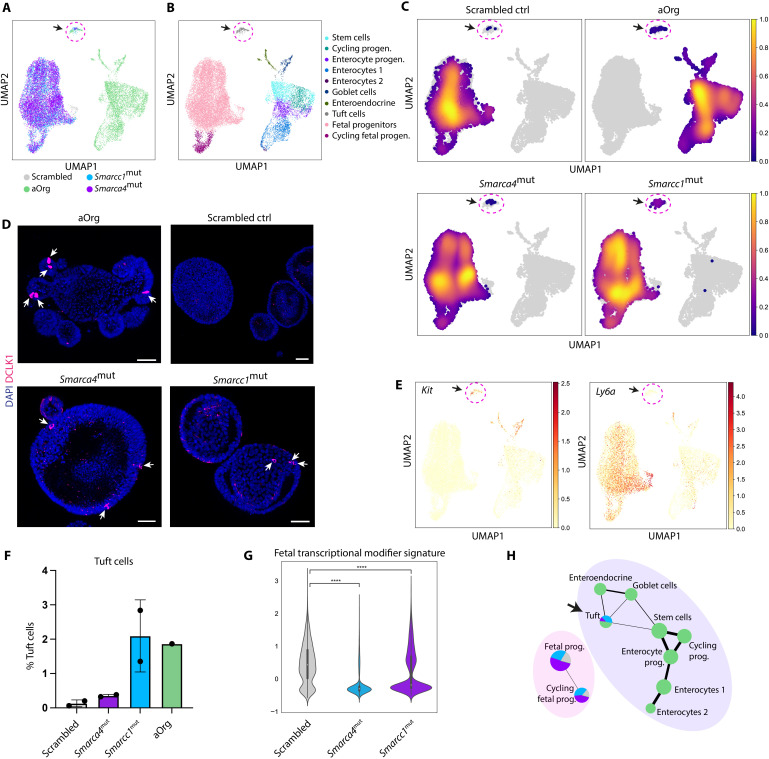
Fig. 6. Increased frequency of adult tuft cells in Smarca4mut and Smarcc1mut organoids.
(A) UMAP of scRNA-seq data from scrambled control (gray), Smarca4mut (purple), and Smarcc1mut (light blue) fetal organoids each in biological duplicates, as well as aOrg (green) from the WT dataset shown in Fig. 1. (B) UMAP showing cell type clusters. (C) UMAP showing the cell density of individual samples (scrambled control, aOrg, Smarca4mut, and Smarcc1mut) on the clusters in (B). The arrow and dotted circle indicate tuft cells [see (A) and (B)]. (D) Three-dimensional immunofluorescence images of DCLK1 expression in WT aOrgs, scrambled control, Smarca4mut, and Smarcc1mut organoids. Arrows = DCLK1+ cells. Scale bars, 50 μm. (E) UMAP showing expression of Kit (left) and Ly6a (right). (F) Bar plot showing the percentage of tuft cells in scrambled control, Smarca4mut, and Smarcc1mut fetal organoids in biological duplicates and WT aOrg. Error bars indicate SD. (G) Violin plot showing the expression of the fetal transcriptional modifier signature (Fig. 2B) in cells from the fetal progenitor cluster of scrambled control, Smarca4mut, and Smarcc1mut organoids. ****P < 0.0001, Mann-Whitney U test using Bonferroni correction. (H) PAGA trajectory graph on clusters from (B). The color of the nodes represents the frequency distribution of samples (aOrg, scrambled control, Smarca4mut, or Smarcc1mut) in the different clusters. The size of the nodes is proportional to the number of cells in a cluster, and the thickness of the edges represents confidence in the presence of the transcriptional connection.

