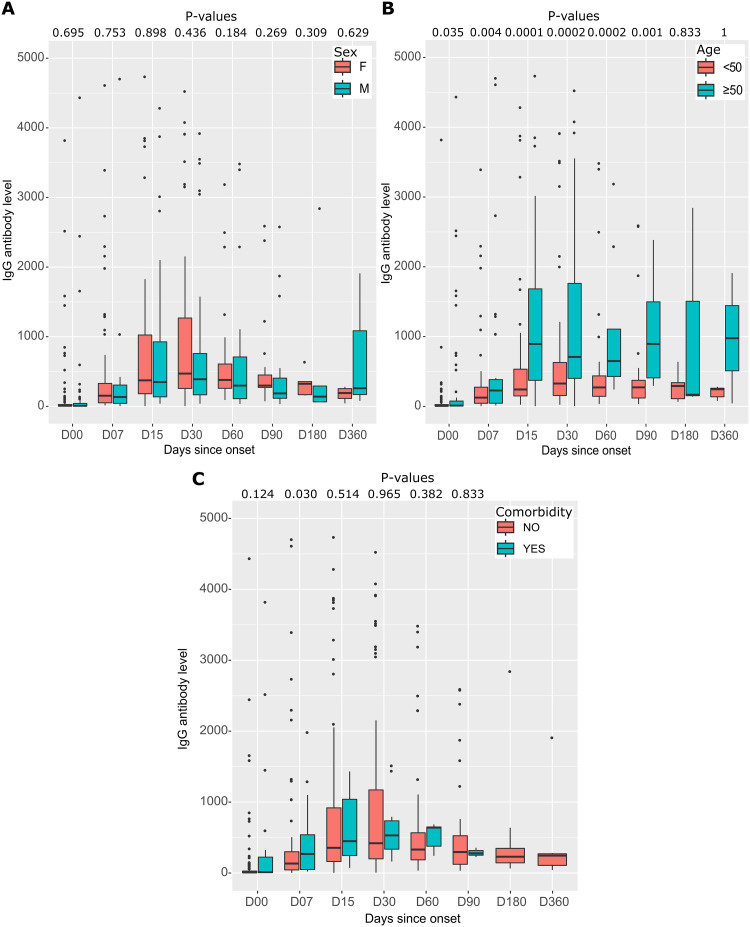
Fig 7. Distribution and differences of anti-RBD IgG antibodies to SARS-CoV-2 by sex, age, and comorbidity during follow-up.
(A) anti-RBD IgG antibody levels by sex, with the distribution of antibody levels in each group represented by box plots. (B) anti-RBD IgG antibody levels by age, with the 167 participants divided into two groups based on age: under 50 years and over 50 years. Each age range is represented by a separate box plot. (C) IgG antibody levels according to the presence or absence of comorbidities, with the distribution of antibody levels in each group represented by box plots. In all three graphs, P-values are calculated using the Mann-Whitney test.

