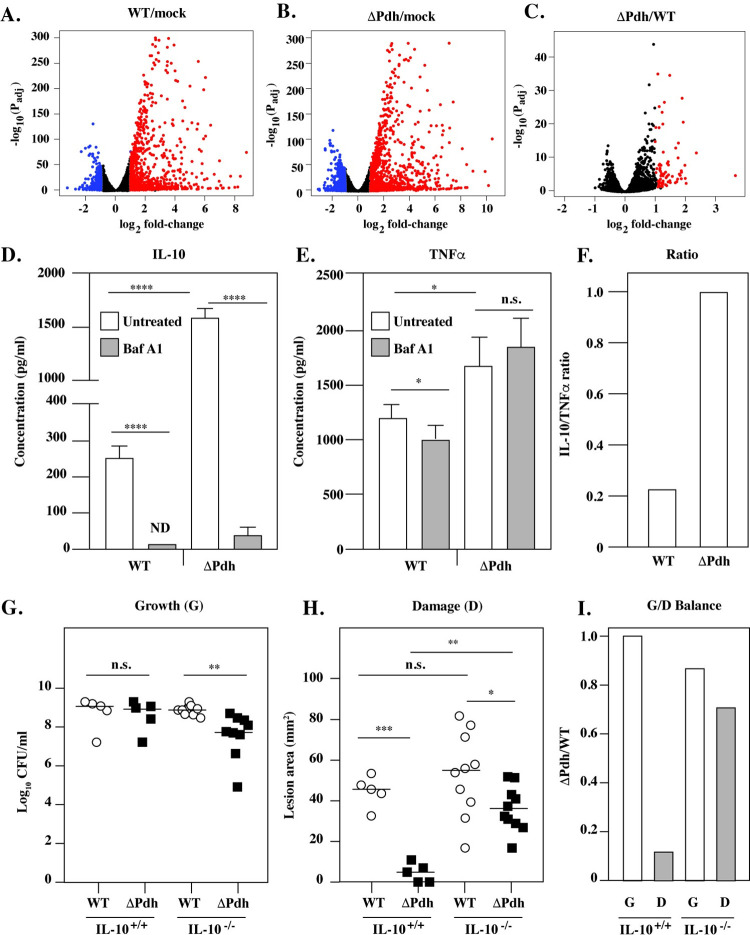
Fig 6. Differential expression of IL-10 between WT- and ΔPdh-infected macrophages.
Cultured Raw264.7 cells were infected by WT, ΔPdh or PBS (mock) for 4 hrs. Overall differences in gene expression are shown in Volcano plots of statistically significantly differentially expressed genes for the indicated comparisons (A, B, C). Genes regulated up or down regulated with a log2 fold-change > 1.0 are shown in red and blue, respectively. Supernatants from cells infected and untreated or treated with Bafilomycin A1 (Baf A1) were analyzed to determine concentrations of IL-10 (D) and TNFα (E) and the IL-10/TNFα ratio determined for untreated infected cells (F). Subcutaneous infection of the indicated strains in IL-10+/+ and IL-10-/- C57BL/6 mice is shown, comparing Growth (G), Damage (H) and the Growth/Damage ratio calculated for ΔPdh vs WT (I). For G and H, each symbol represents an individual mouse, pooled from two individual experiments, with differences compared to WT. Where indicated, *, P < 0.05; **, P < 0.05; ****, P < 0.001; n.s., not significant.

