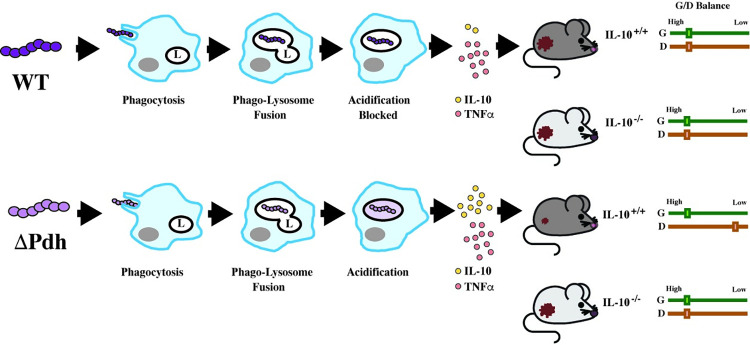
Fig 7. Model for PDH regulation of growth/damage balance.
Shown is a comparison of WT and ΔPdh mutant phenotypes observed in macrophages in vitro and for murine subcutaneous infection. The steps of infection in macrophages are shown in temporal order from left to right by the closed arrows and are labeled as indicated (featuring: L, lysosome; grey oval, nucleus), resulting in the ratio of the cytokines IL-10 and TNFα represented by frequency of the symbols indicated, which correlates (as shown by the open arrows) to the mouse infection phenotypes shown at the right of the Figure. Relative areas of the resulting lesions are represented as small or large in mice whose IL-10 genotypes are noted. Growth/Damage balance (G/D Balance) for IL-10+/+ or IL-10-/- mice are shown by the paired sliders at the very right of the Figure, with the relative degree of Growth (G, green) and Damage (D, red) indicated by a box on a scale from Low to High, as shown.

