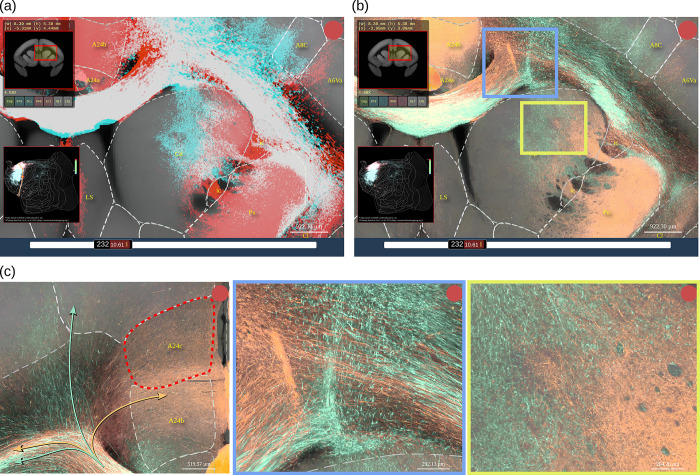
Fig 3. The BMCR-Explorer.
Example screenshots from the BMCR-Explorer demonstrating a virtual overlay of axon fibers originating from tracer injection into area 24b and area 6M in 2 different marmosets. (a) Tracer segmentation masks for the 2 samples are shown in red and cyan. In this display mode, the overlap between the 2 tracers appears in white. Dashed lines are indicating anatomical annotations from an atlas (in this example, the Brain/MINDS Atlas). The top left and bottom left panels show the position of the ROI in the coronal section and in the flatmap. (b) Same as in panel (a) except that the figure shows the original image data in 2 pseudo colors instead of the segmentation mask. (c) High-resolution views of panel (b) showing fine details of axonal trajectories. Data availability: The images shown in the figure are from 2 marmoset brains with the IDs R01_0098 and R04_0079. The data is publicly accessible from the BMCR-Explorer (http://bmca.riken.jp/). BMCR, Brain/MINDS Marmoset Connectivity Resource.

