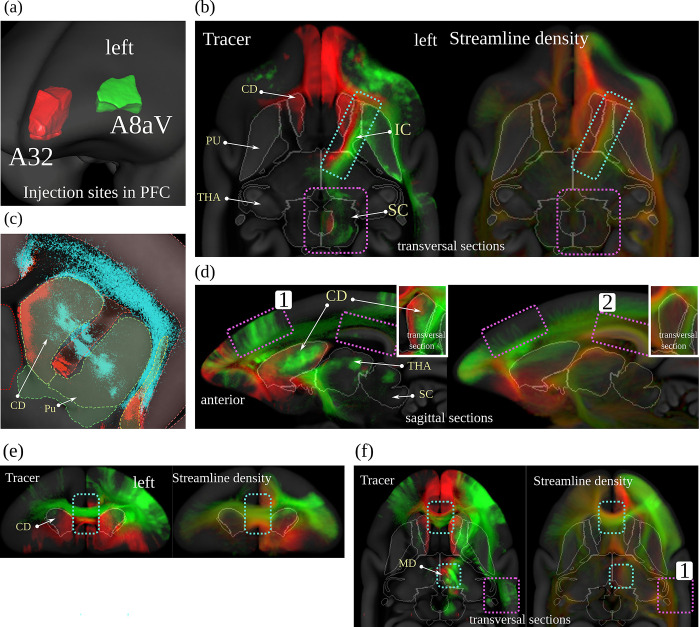
Fig 5. dMRI tractography and neural tracer.
Visual comparison between dMRI-based streamline density and anterograde neural tracers originating in 2 distinct regions in the marmoset PFC. Each of the 2 colors represents the maximum intensity over all anterograde tracer images that have been injected into one of the 2 regions in the marmoset PFC (A32: red, A8aV: green (cyan in (c))). Panel (a) shows the injection regions, (b) shows separate streams in the internal capsule. Panel (c) shows details in the caudate nucleus. In panel (d), cortical projections differ in tracer and dMRI (purple boxes). Panel (e) shows separate streams in the corpus callosum, and in (f) we see wrong streamlines (red) in dMRI (purple boxes). The similarity between the images suggests that dMRI reflects real brain connectivity (cyan boxes with dashed borders in (b), (d), (e), and (f)) but also shows evidence of the relative imprecision of dMRI data in terms of specificity and sensitivity (violet boxes with dashed border). Data availability: The source code that generated the image is publicly available (https://doi.org/10.5281/zenodo.7906530, filename: BMCR_Fig 05.m), and the corresponding data are publicly available on the CBS Data Sharing Platform (https://doi.org/10.60178/cbs.20230630-001). dMRI, diffusion-weighted MRI; PFC, prefrontal cortex.

