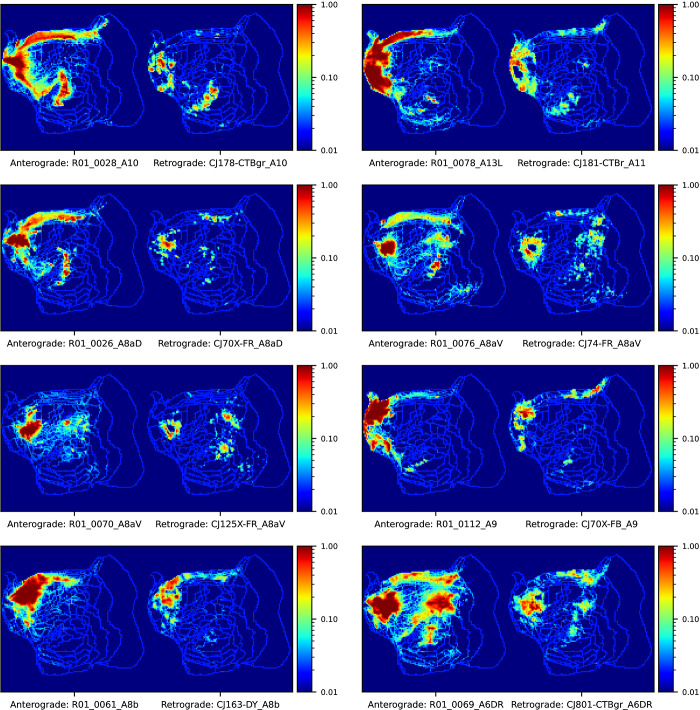
Fig 8. Visual comparison between anterograde and retrograde tracers.
We measured the similarity between anterograde and retrograde tracers based on the normalized cross correlation of flatmap stack images of tracer patterns in the cortex. The image shows maximum intensity projections from pairs of images of anterograde and retrograde injections from the BMCR and the Marmoset Brain Connectivity Atlas, respectively. The pairs were formed with respect to the closed distances between injection sites. The shown flatmap shapes are consistent with the Marmoset Brain Mapping flatmap. The outline of cortical regions are based on annotations from the Marmoset Brain Connectivity Atlas. Data availability: The source code that generated the figures is publicly available (https://doi.org/10.5281/zenodo.7906530, filename: BMCR_Fig 07_Fig 08.ipynb), and the corresponding data are publicly available on the CBS Data Sharing Platform (https://doi.org/10.60178/cbs.20230630-001). BMCR, Brain/MINDS Marmoset Connectivity Resource.

