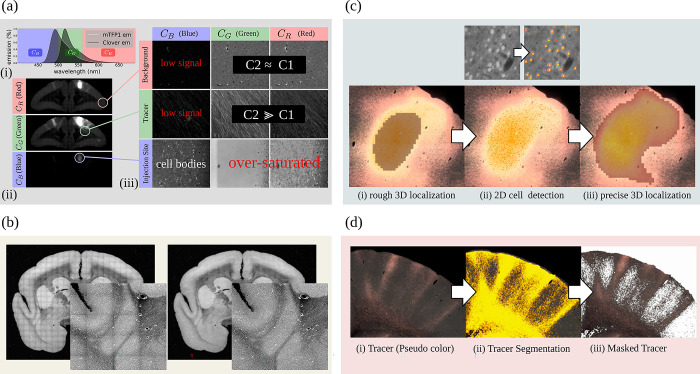
Fig 10. Anterograde tracer data from STPT.
(a) The fluorescent emission profile of the anterograde tracer. (b) A coronal section of the STPT microscope (first channel) before and after intensity correction. (c) Illustration of the injection sites localization and (d) the anterograde tracer segmentation. STPT, serial two-photon tomography.

