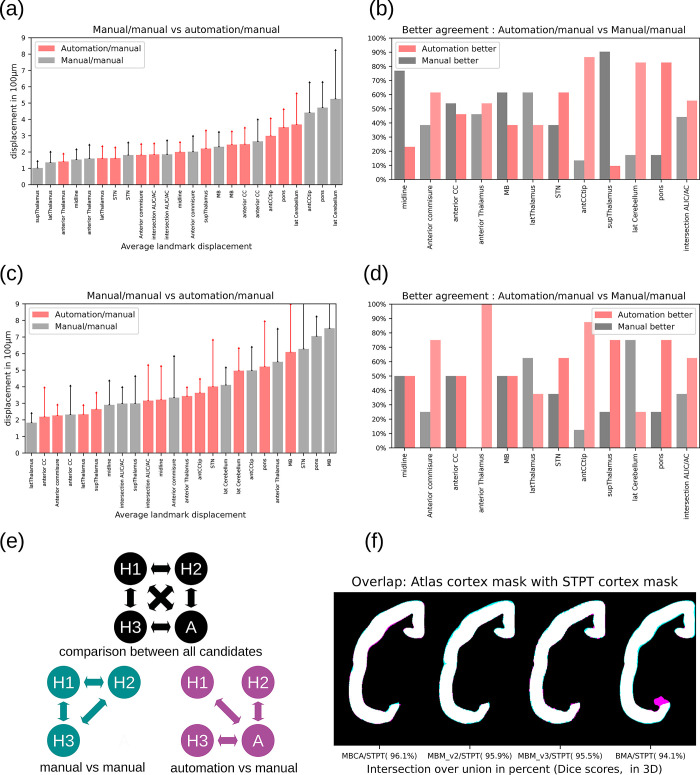
Fig 18. Evaluation of the image registration.
Quantitative evaluation of the image registration based on landmarks and cortical atlas labels shows that the pipeline maintains or even exceeds manual accuracy. Panel (a) shows the average displacement of landmarks placed by different human experts (manual/manual) compared to the displacement of landmarks between automation and a human expert (automation/manual). The plot in panel (b) shows how often an automated landmark position was closer to a manually placed landmark location than the locations from 2 different human annotators. Panels (c) and (d) show the results for the 4 other marmoset brain atlases and our STPT template space. The procedures were the same as for panels (a) and (b). Panel (e) We split the annotations in 2 groups. We compared the median agreement of landmark locations among humans (manual vs. manual) with the median agreement among human and automation. Panel (f) shows the overlap of the cortex annotation from the atlases with our own annotation after image registration (MBCA: Marmoset Brain Connectivity Atlas, MBM: Marmoset Brain Mapping, BMA: Brain/MINDS Atlas). The cortex mask of the STPT is drawn in cyan, the masks of the other templates in magenta. Overlaps appear in white. Data availability: The source code that generated the plot and images is publicly available (https://doi.org/10.5281/zenodo.7906530, filenames: BMCR_Fig 18_ab.ipynb and BMCR_Fig 18_cdf.ipynb), and the corresponding data is publicly available on the CBS Data Sharing Platform (https://doi.org/10.60178/cbs.20230630-001). STPT, serial two-photon tomography.

