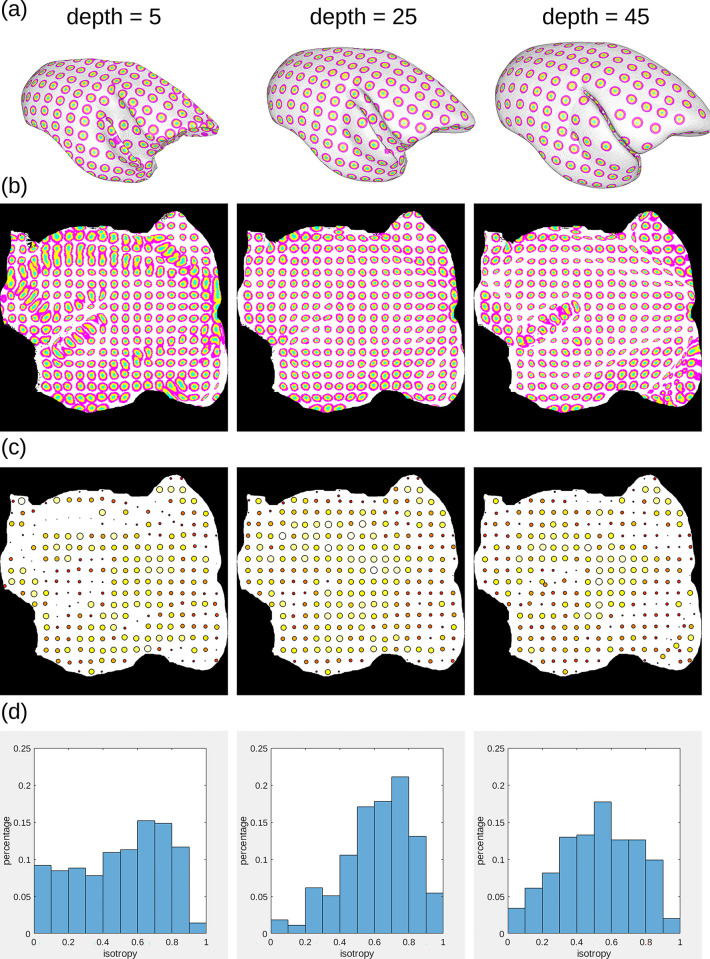
Fig 19. Evaluating the flatmap stack mapping.
We qualitatively and quantitatively validated the deformations of the flatmap stack mapping for 3 different levels of cortical depth. Each column in this figure corresponds to a level. Level 5 is located close to the WM/GM border, while level 45 is close to the pia-matter. Anisotropic deformations appear in parts with gyrifications in either the lower or upper levels. Panel (a) shows the intersection with spheres (Volume rendering), panel (b) images of the spheres mapped back to the corresponding flatmap stack layer. Row (c) shows the degree of isotropy as heat maps and circle size, and (d) histograms of the degrees of isotropy. Data availability: The source code that generated the plots and images is publicly available (https://doi.org/10.5281/zenodo.7906530, filename: BMCR_Fig 19.m), and the corresponding data is publicly available on the CBS Data Sharing Platform (https://doi.org/10.60178/cbs.20230630-001).

