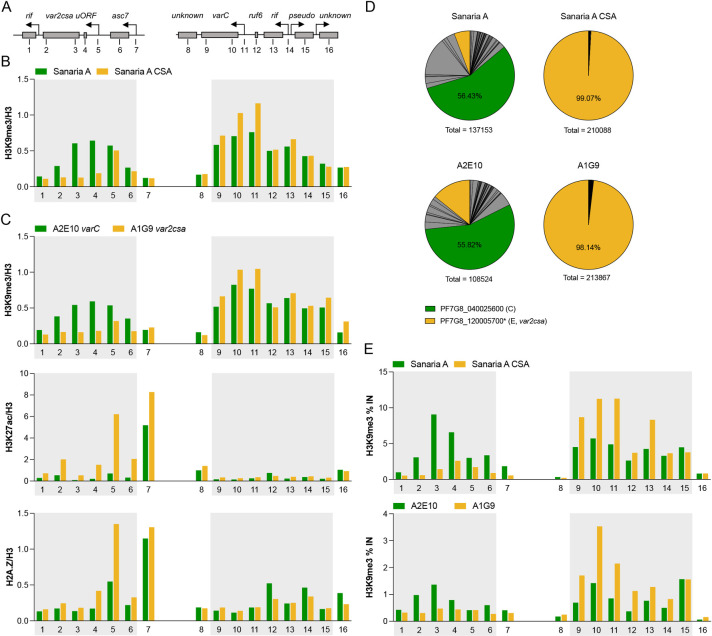
Fig 4. Epigenetic marks at the Pf7G8_040025600 and var2csa loci.
(A) Genomic map of var2csa and Pf7G8_040025600 (‘varC’) loci with surrounding open reading frames (ORFs) and transcription start sites (indicated by arrows). The positions of the respective primer pairs used for ChIP-qPCR are indicated by numbers. (B) Chromatin immunoprecipitation with anti-H3K9me3 antibody and quantification of associated gDNA regions of var2csa (left panel) and Pf7G8_040025600 loci (right panel) by qPCR (ChIP-qPCR) in ring-stage Sanaria pre-mosquito cell bank parasites (aliquot A, ’Sanaria A’) and the same parasite line enriched for CSA-binding (’Sanaria A CSA’) (n = 1). ChIP data were normalized to ChIP input and H3 levels determined in parallel. (C) Levels of gDNA marked with the heterochromatin-associated H3K9me3, the activation mark H3K27ac, or the alternative histone variant H2A.Z associated with active gene expression were determined by ChIP-qPCR at different regions of the var2csa (left panels) and Pf7G8_040025600 (right panels) loci in subclones A2E10 (expressing C-type Pf7G8_040025600) and A1G9 (expressing E-type var2csa) (n = 1). (D) The corresponding expression profiles of var genes from RNA obtained in parallel with nuclei for ChIP experiments are shown as pie charts, with var2csa and Pf7G8_040025600 colored as indicated and all remaining var gene variants colored grey. Summarized total var gene expression is indicated for each parasite line. (E) ChIP-qPCR with anti-H3K9me3 antibody of gametocytes from Sanaria A and Sanaria A CSA (stage III) and from subclonal lines A2E10 and A1G1 (stage III/IV) at different regions of the var2csa (left panels) and Pf7G8_040025600 (right panels) loci. ChIP data are shown as % of input. The boundaries of the predicted heterochromatin regions are shaded in B, C and E.

