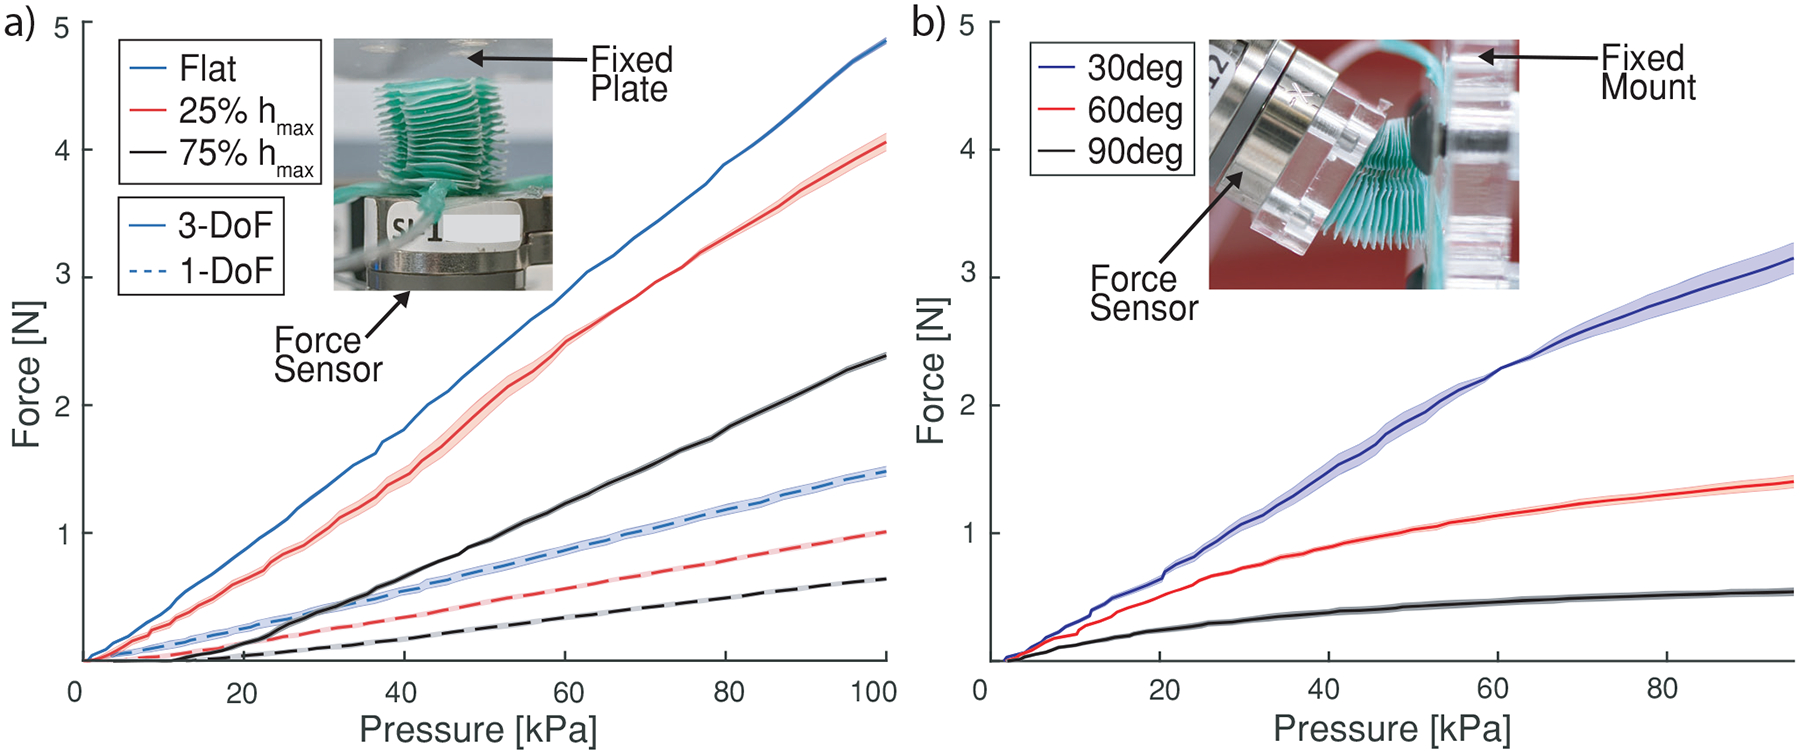
Figure 8:

Force characterizations for SBAs in extension and bending. Experimental curves show average values with one standard deviation. a) Force vs Pressure: one 1-DoF SBA (solid line) and one 3-DoF SBA (dashed line) were inflated against a force sensor at three height increments. The inset shows a picture of the tests setup with a 3-DoF SBA at 25% elongation pushing against the force sensor. b) Force vs Pressure: one 3-DoF SBA was inflated against a force sensor at three bending angles. The inset shows a picture of the tests setup with a 3-DoF SBA pushing against a force sensor at 30°.
