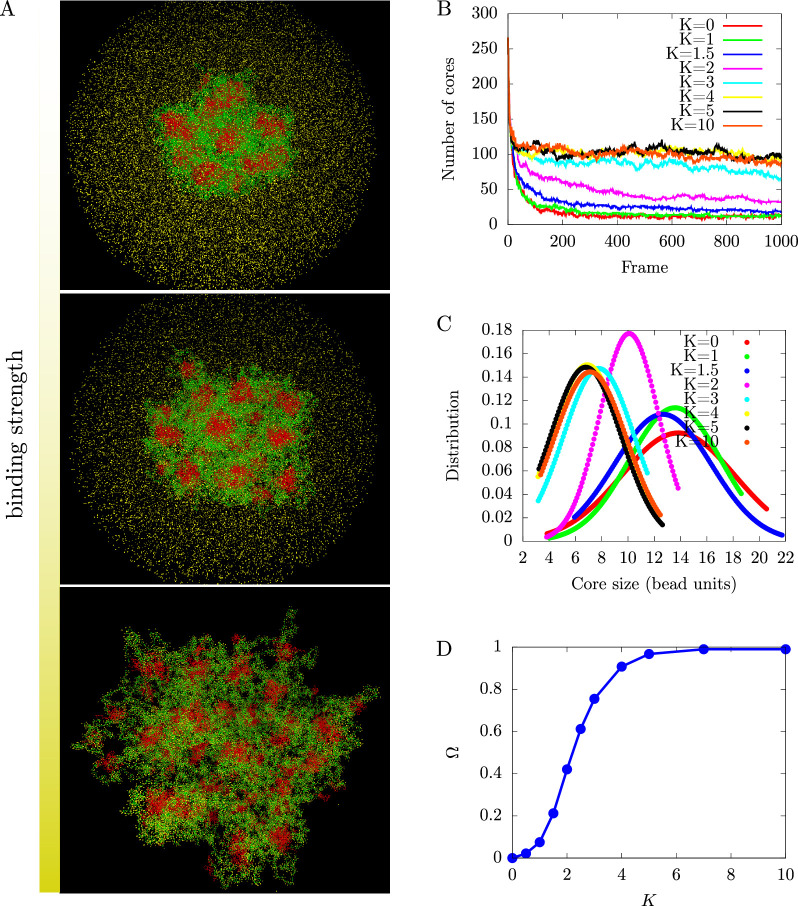
Figure 5. Regulation of chromatin microphase separation by binding of protein complexes.
(A) Simulation snapshots show a core-shell organization of chromatin. The cores (red area) are composed of inactive blocks (red lines) of chromatin, and the shells (green area) are composed of active blocks (green lines) of chromatin. The snapshots from top to bottom correspond to binding of protein complexes (yellow points) to chromatin where deviations of the bond distance from its minimal value are modeled by a harmonic potential with a spring constant (no binding, top), (weak binding, middle), and (strong binding, bottom). (B) Number of cores as a function of the simulation time frame by varying the harmonic potential characterized by of protein complexes. The number of cores increases with increasing bonding strength until it saturates. (C) Core size distributions for different bonding strengths, . (D) Fraction of active monomers bound to a protein complex, , as a function of bonding strengths follows a sigmoidal curve.

