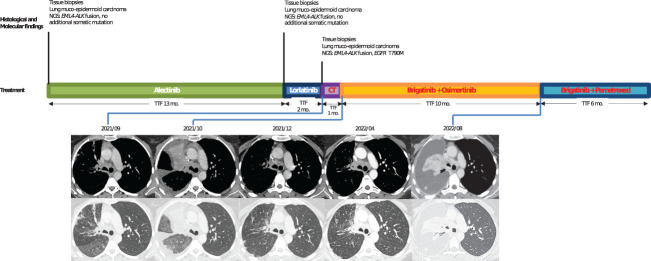
Figure 2.
Case 2: timeline illustrating the changes in therapeutic regimen in correlation with molecular and radiological findings. NGS, next-generation sequencing; TTF, time to treatment failure; Mo., months; CT, chemotherapy. In red, the treatments used when EGFR resistance mutation was identified.

