Fig. 3.

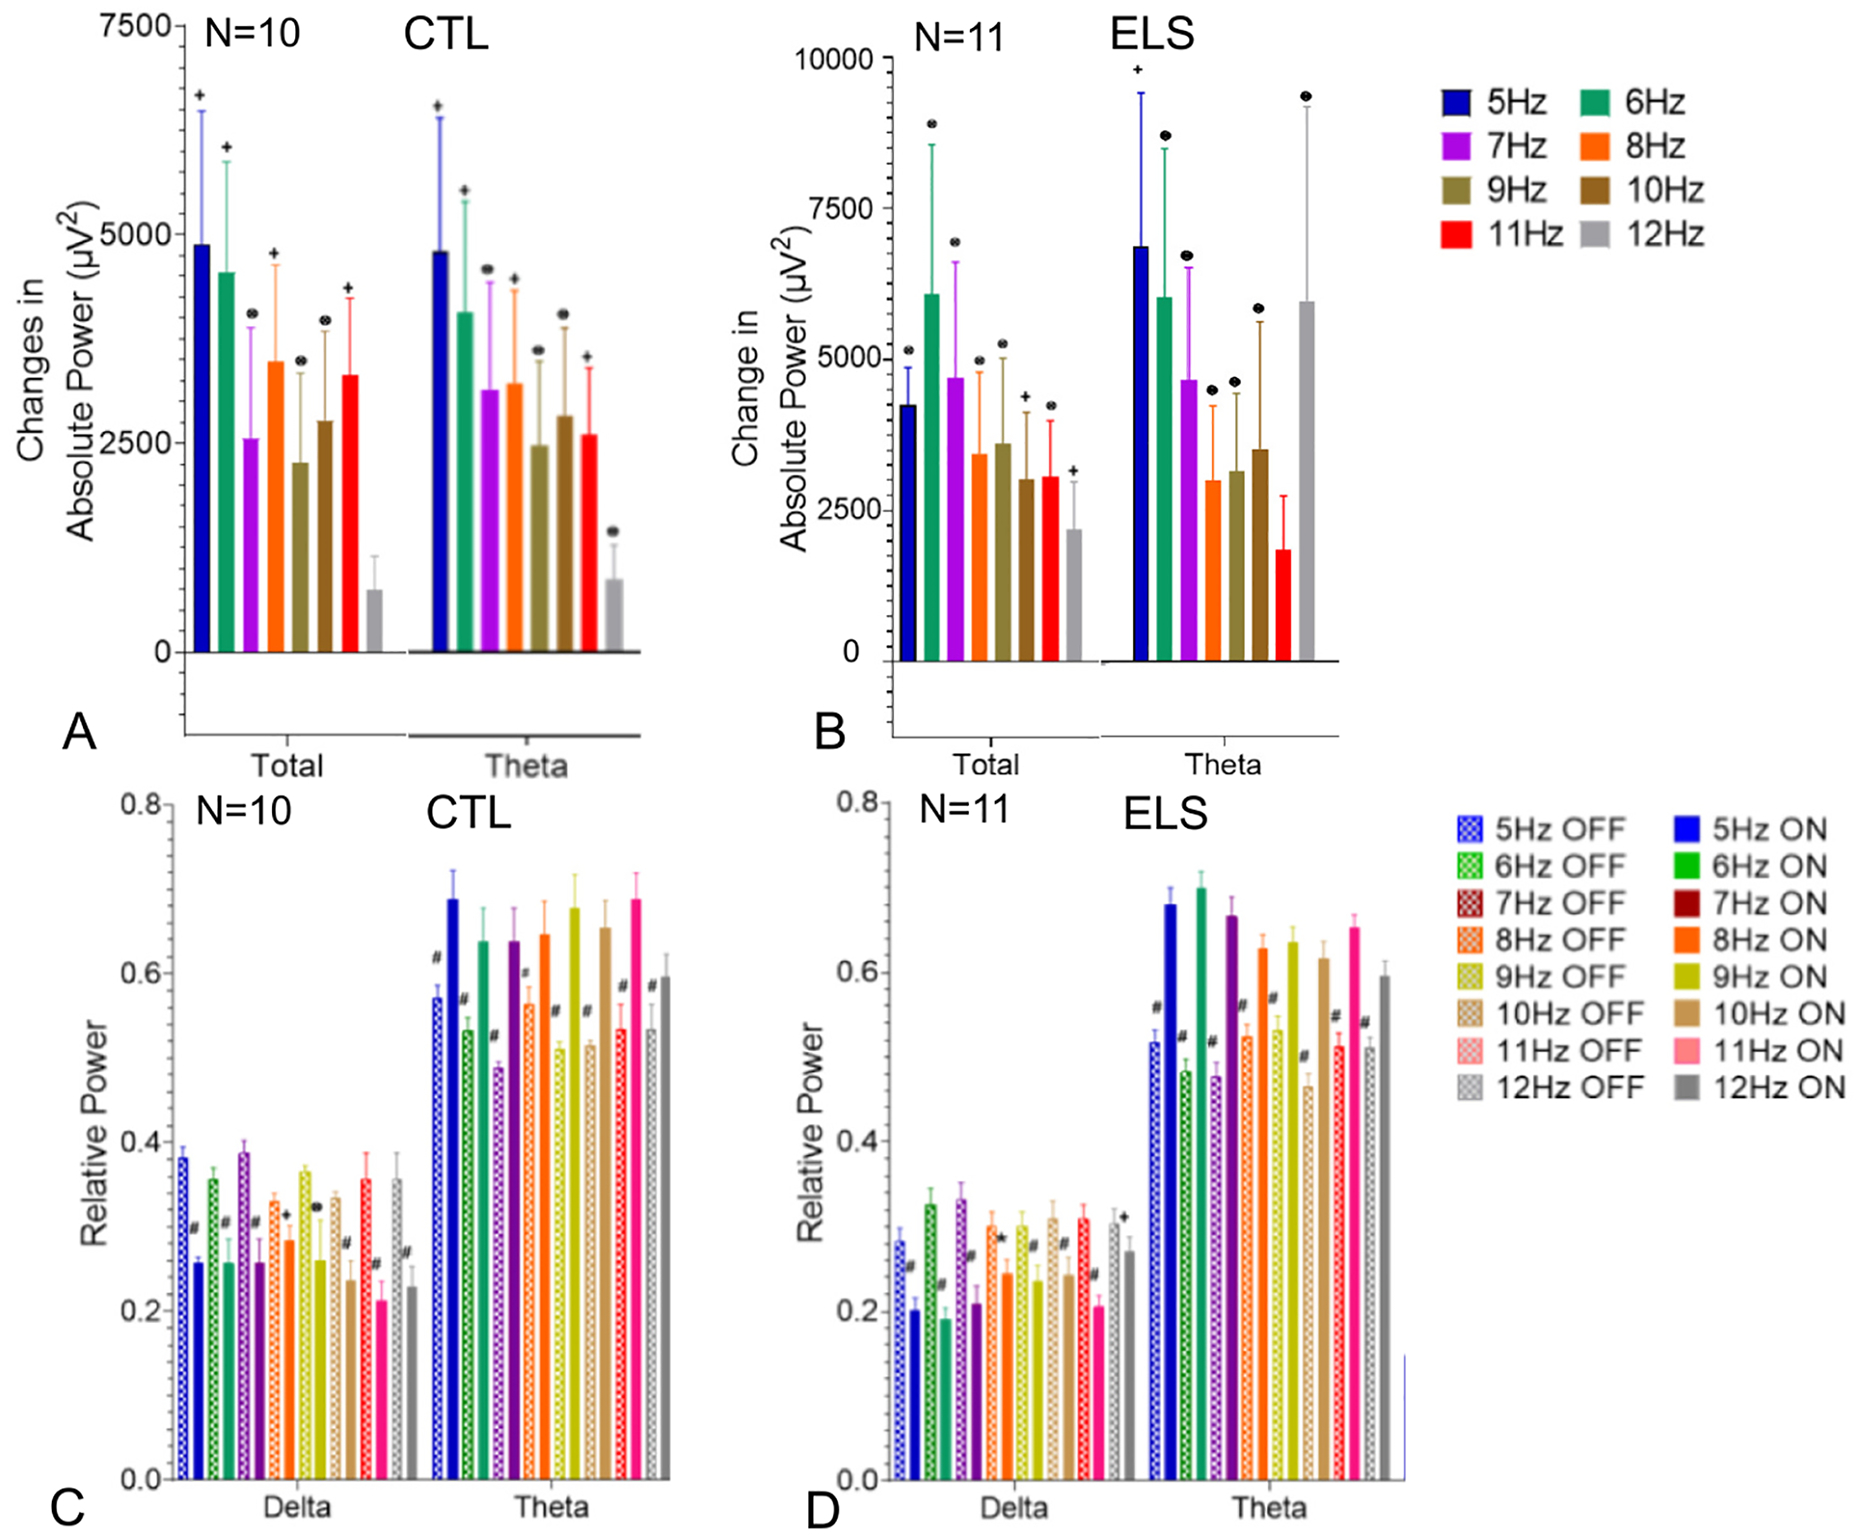
Effects of MS 5–12 Hz optogenetic stimulation on CA1 EEG absolute power in CTL-BL (A) and ELS-BL (B) and relative power in CTL-BL (C) and ELS-BL (D). The graphs show the change in absolute power and relative power from pre-stimulation EEG to MS optogenetic stimulation from 5 to 12 Hz in total (delta + theta + slow gamma and med. Gamma frequencies) and theta. and changes in In both the CTL (A) and ELS (B) groups there was an increase to total and theta absolute power with stimulation from 5 to 12 Hz. In both the CTL (C) and ELS (D) groups there was a decrease in relative delta and increase in relative theta. Data from all bands are shown in Supplementary Figs. 4, 5. (p values: ⊗ ≤0.05; + ≤0.01; * ≤0.001; # ≤0.0001).
