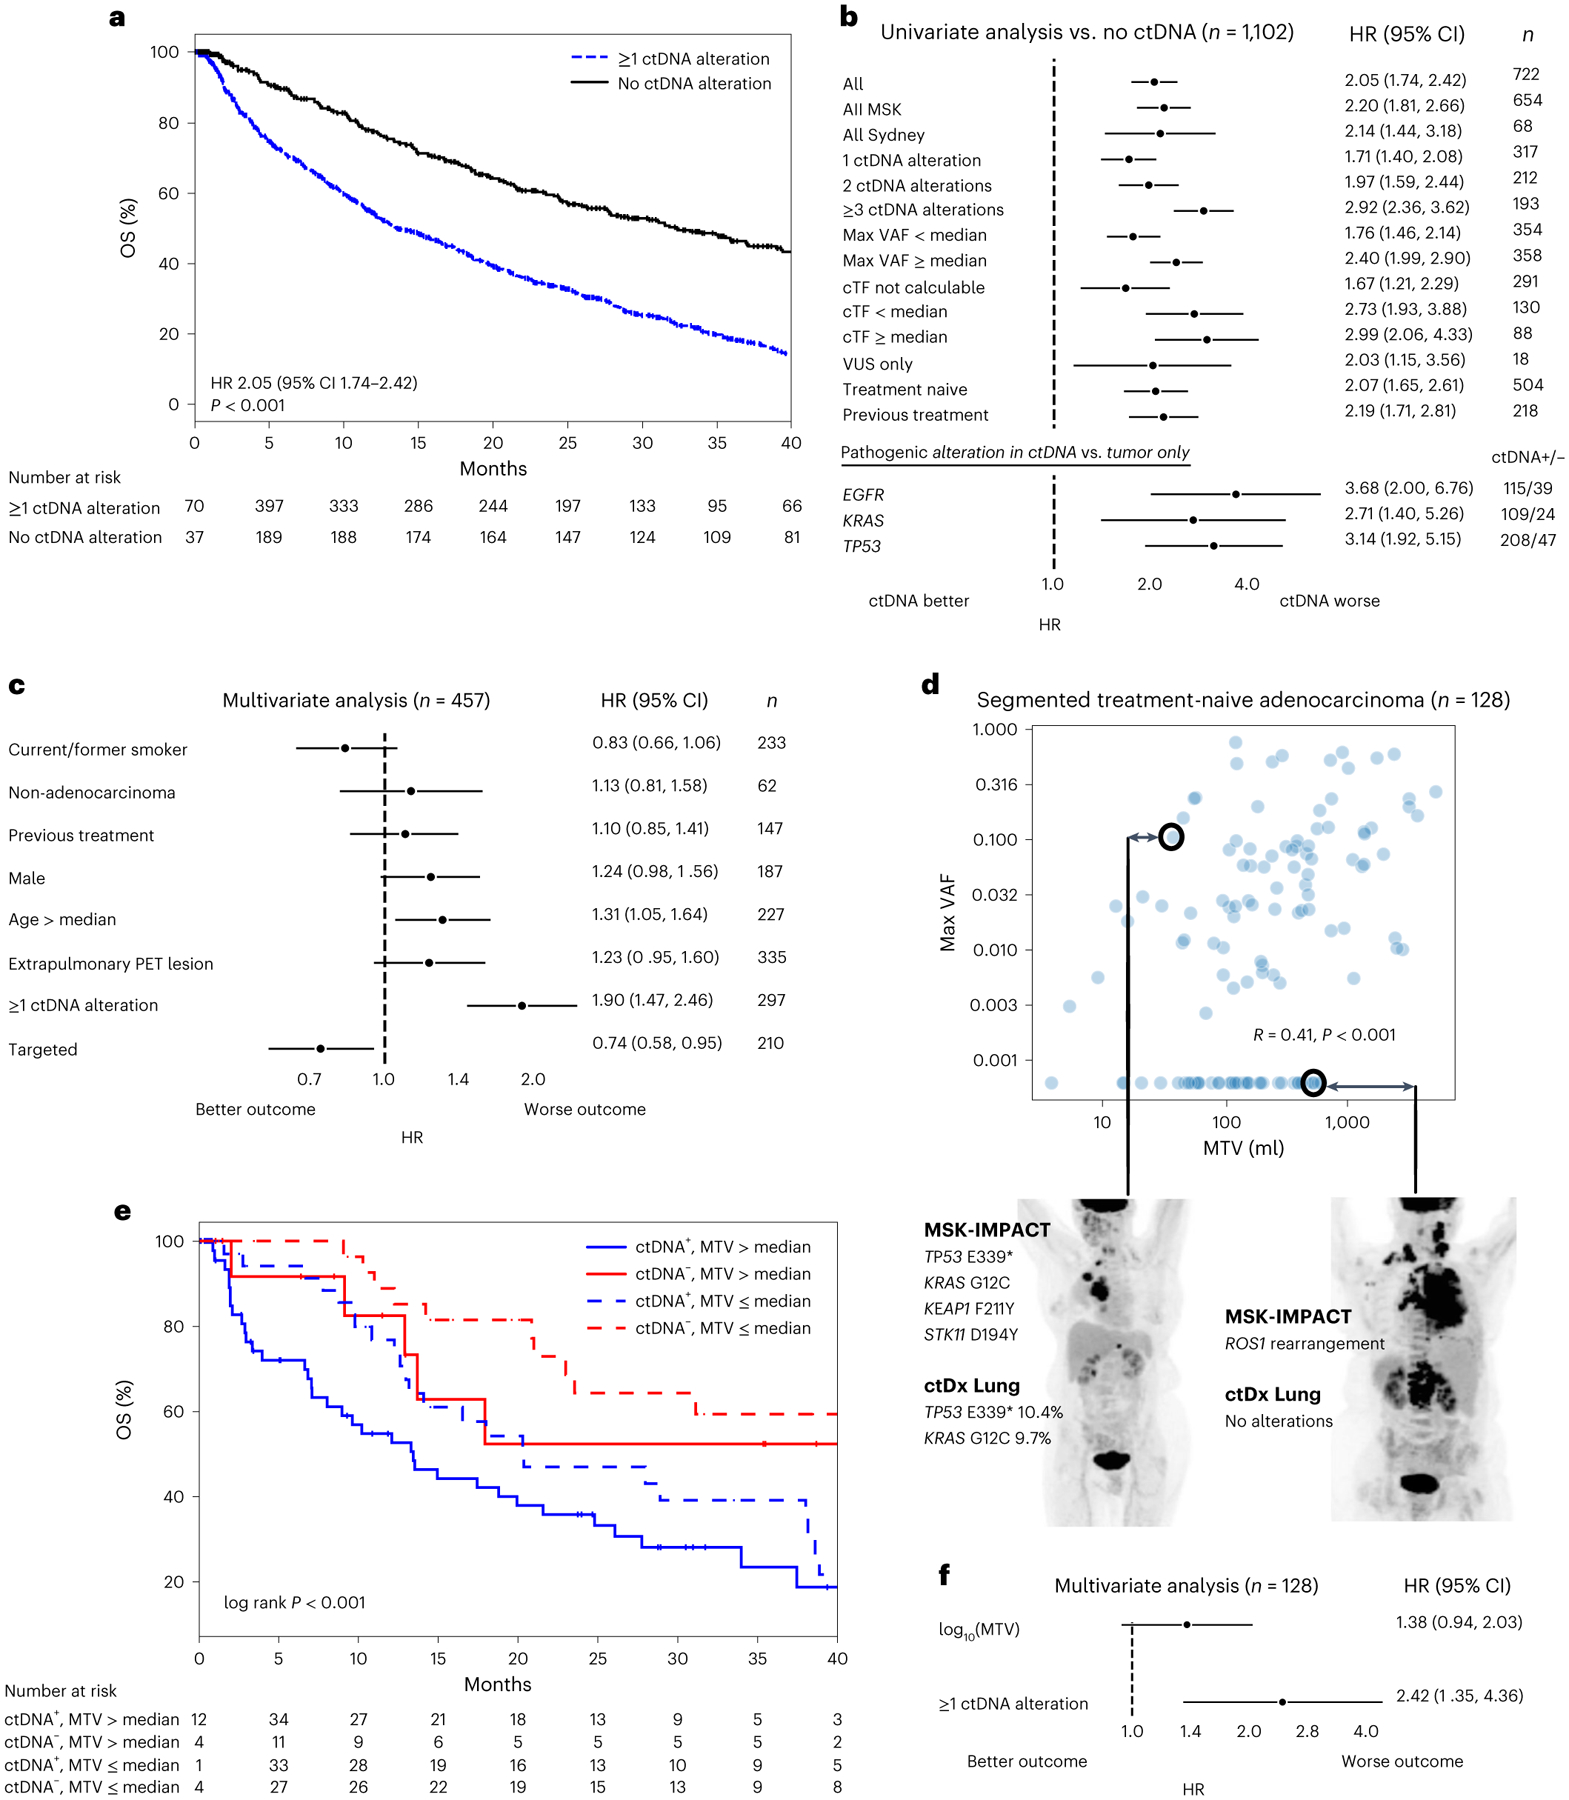
Fig. 2 |. ctDNA alterations and OS.

a, Kaplan–Meier survival curves for patients with versus without ctDNA detected (defined by alteration presence). Number at risk adjusted for study/variable entry time. b, Forest plots comparing patients with versus without ctDNA alterations in the listed subgroups (median OS and the number of independent patients in both the ctDNA+ and ctDNA− arms are given in Supplementary Table 3). Error bars represent 95% CI. EGFR, KRAS and TP53 subgroups compare patients with alterations in these genes in ctDNA to those with alterations in these genes in tumor tissue only. c, Multivariate Cox proportional hazards model with the listed variables in patients with time-matched PET imaging. ‘Targeted’, treated with targeted therapy. Error bars represent 95% CI. Total cohort size and number of independent patients in each variable arm are listed in the figure (n). d, Scatterplot showing the relationship between ctDNA maximum VAF and MTV among segmented patients with treatment-naive adenocarcinoma. Values of zero are set to the minimum of the respective log axes. R and P values from two-sided Spearman’s correlation coefficient (P = 2 × 10⁻⁶). Representative examples of discordance between MTV and VAF are shown. e. Kaplan–Meier survival curves for patients stratified by MTV and ctDNA detection. Number at risk adjusted for study/variable entry time. f, Multivariate Cox proportional hazards model with log10(MTV) as a continuous variable and ctDNA detection. Error bars represent 95% CI. n, number of independent patients in the total analysis.
