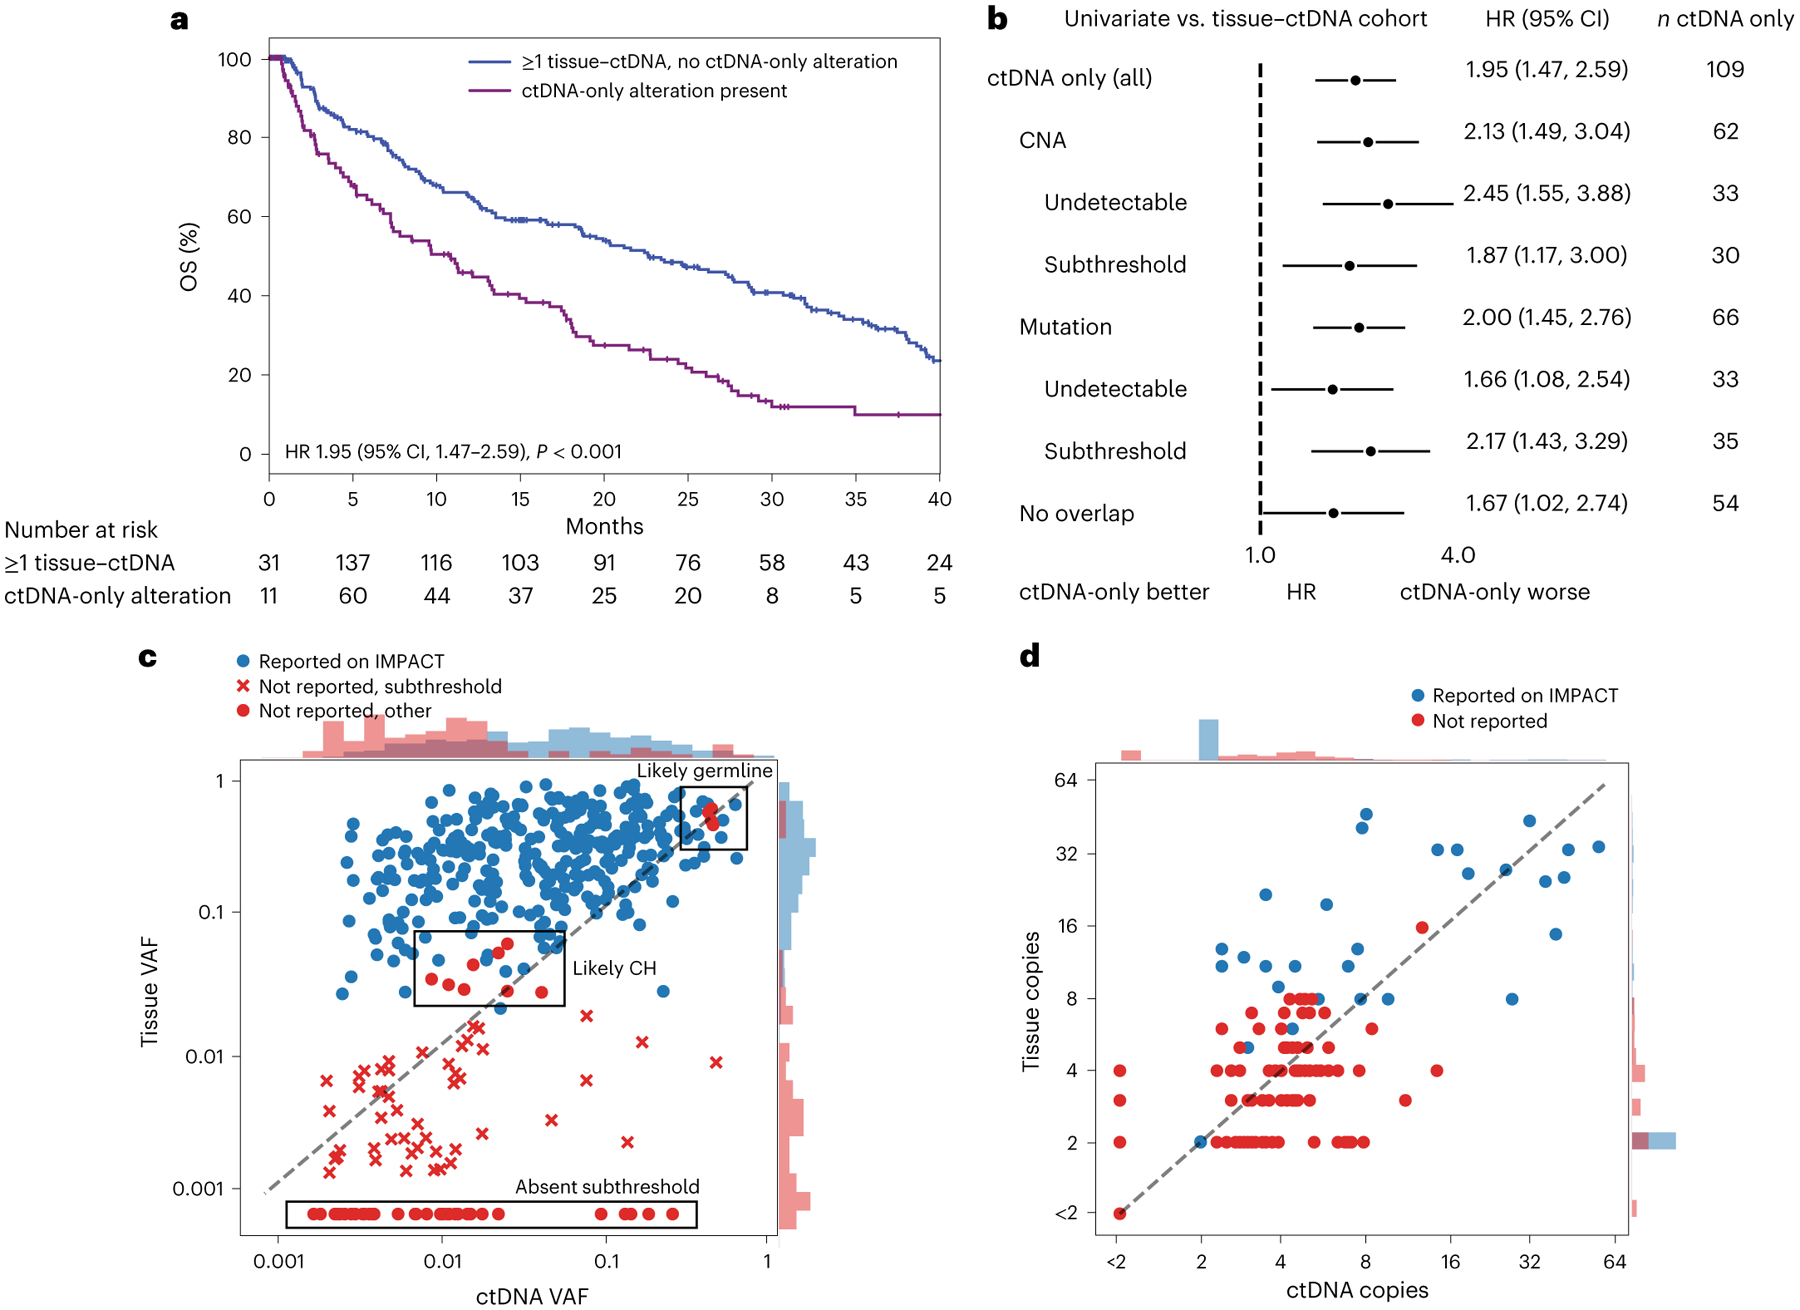
Fig. 4 |. ctDNA mutations not detected on time-matched tissue sequencing (MSK-IMPACT).

a, Kaplan–Meier survival curves for patients without ctDNA alterations (black) or with ctDNA-only alterations (purple), compared by two-sided Cox proportional hazards model (P = 1 × 10⁻⁵). b, Forest plots comparing patients with ctDNA-only alterations versus those with matched ctDNA–tissue alterations only in the listed subgroups (the median OS and number of independent patients in each arm are given in Supplementary Table 8). Error bars represent 95% CI. c,d, Scatterplots of mutations (c) and CNAs (d) detected in ctDNA. Red dots correspond to ctDNA-only alterations. The y axis in d shows CNA levels calculated algorithmically from tissue MSK-IMPACT. Histograms at the top and right show the density of points of each category along the respective axis. Raw values of zero were set to the minimum value of the log axis.
